. 2010 Mar;108(3):544-53.
doi: 10.1152/japplphysiol.01079.2009. Epub 2010 Jan 7.

Rhythmic contraction generates adjustable passive stiffness in rabbit detrusor

Affiliations

Rhythmic contraction generates adjustable passive stiffness in rabbit detrusor

Atheer M Almasri et al. J Appl Physiol (1985). 2010 Mar.

Abstract

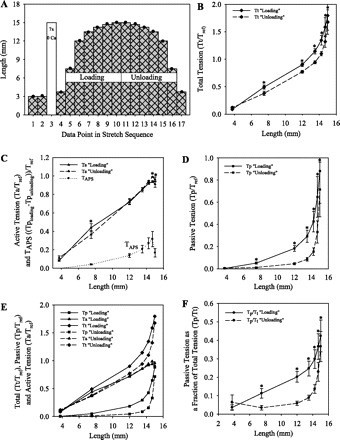
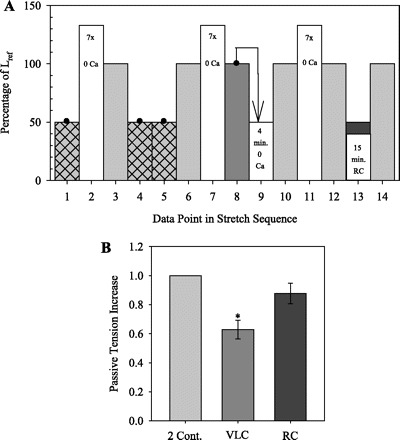
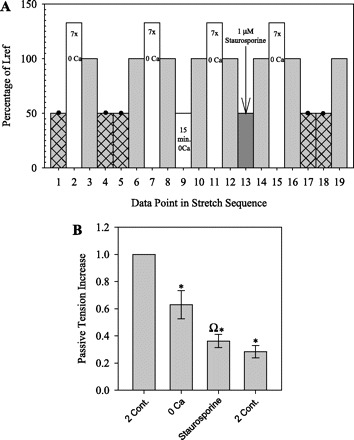
The length-tension (L-T) relationships in airway and vascular smooth muscles have been shown to adapt with length changes over time. Our prior studies have shown that the active and passive L-T relationships in rabbit detrusor smooth muscle (DSM) can adapt and that DSM exhibits adjustable passive stiffness (APS) characterized by a passive L-T curve that is a function of strain and activation history. The present study demonstrates that passive tension due to APS can represent a substantial fraction of total tension over a broad length range. Our previous studies have shown that maximal KCl-induced contractions at short muscle lengths generate APS that is revealed by increased pseudo-steady-state passive tension at longer lengths compared with previous measurements at those lengths. The objective of the present study was to determine the mechanisms involved in APS generation. Increasing the number of KCl-induced contractions or the duration of a contraction increased the amount of APS generated. Furthermore, a fraction of APS was restored in calcium-free solution and was sensitive to the general serine and threonine protein kinase inhibitor staurosporine. Most importantly, rhythmic contraction (RC) generated APS, and because RC occurs spontaneously in human bladder, a physiological role for RC was potentially identified.


Figures

Fig. 1.
Fig. 1.
A: sample data illustrating the tension measurement protocol. Detrusor smooth muscle (DSM) strips were incubated for 2 min in Ca2+-free solution (0 Ca); stretched or released to the muscle length of interest, if necessary; incubated for an additional 2 min in 0 Ca; incubated in modified physiological salt solution (PSS) for 3 min; and then incubated in PSS modified to include KCl rather than NaCl (KPSS) for 1 min to induce a contraction. T, tension; Tpeak, peak tension. B: reference length (Lref) identification protocol. Passive tension (Tp) and active tension (Ta) were measured at each length in a sequence of 3-mm steps from 3 mm to 12, 15, or 18 mm until a peak in the L-Ta curve was identified, and the corresponding length was designated as Lref. C: sample data from 3 tissues with Lref at 9 (●), 12 (▴), and 15 mm (■), respectively. Ta_max, maximum active tension.
Fig. 2.
Fig. 2.
A: L-T curve protocol for preconditioned tissues. After 7 preconditioning stretches to 15 mm, L-T measurements were made at increasing lengths from 3.75 to 15 mm (“loading” protocol) and then at decreasing lengths (“unloading” protocol). Solid circles indicate KCl-induced contractions. B–E: tension values (means ± SE) were normalized to the maximum Ta value for each tissue (Tref) in L-Tt curves (B), L-Ta curves and Tp due to adjustable passive stiffness (APS), or TAPS curves (C), L-Tp curves (D), and L-T curves from B–D shown together (E). F: Tp as a fraction of Tt (Tp/Tt). *P < 0.05 indicates that the loading and unloading values are significantly different from each other (paired t-test, n = 7).
Fig. 3.
Fig. 3.
A: protocol to determine the effect of the number of contractions and the duration of a contraction on APS reformation. After the determination of Lref (Fig. 1B), 6 pairs of Tp measurements were made at Lref (shaded bars) while in 0 Ca. Before each pair of Tp measurements were made, tissues were strain-softened 7 times in 0 Ca by stretching to 133% Lref and then releasing until they were approximately slack (open bars). Tp was then measured after 1 min of isometric tension redevelopment at Lref (points 3, 8, 14, 18, 22, and 26), one or more contractions were performed at 50% Lref (hatched bars), and then Tp was measured after 10 min of stress relaxation at Lref (points 6, 12, 16, 20, 24, and 29). Between each pair of Tp measurements, 2 contractions, 3 contractions, 1 contraction, a long 24-min contraction, a 4-min incubation in 0 Ca with no contraction, or 2 contractions, respectively, were performed (points 4 and 5, 9–11, 15, 19, 23, and 27 and 28, respectively). Solid circles on the hatched bars indicate a contraction during that tension measurement cycle. B: Tp increase at Lref due to each set of contractions normalized to the increase due to 2 contractions [e.g., (Tp for point 6 minus Tp for point 3)/(Tp for point 6 minus Tp for point 3)]. Values are means ± SE (n = 4). *P < 0.05 indicates a significant difference compared with 1.0. ΩP < 0.025 indicates that incubation in 0 Ca without contraction produced a significantly smaller increase in Tp compared with one contraction. Cont, contractions. C: data from 1 experiment showing a 24-min KCl-induced contraction and washout (w) of the KPSS by 0 Ca. Tmax, maximum tension. D: 1-min Tp redevelopment for points 3 and 22 (inset) and 10-min Tp relaxation for point 6 following 2 contractions and for point 24 following incubation in 0 Ca (mean values, solid and shaded lines, respectively, n = 4). Two-phase exponential curves were fit to the redevelopment data (dotted lines) and relaxation data (dashed lines), extrapolated to 20 min (R2 ≥ 0.993 for all fits).
Fig. 4.
Fig. 4.
A: protocol to determine whether Tp at Lref due to APS could be increased by KCl-induced contractions at that length and whether any increase was inhibited by 1 μM staurosporine. After the determination of Lref (Fig. 1B), 3 pairs of Tp measurements were made while tissues remained in 0 Ca (shaded bars) as in the previous protocol (Fig. 3A). The first pair (points 3 and 6) measured the amount of Tp restored by two 1-min KCl-induced contractions at 50% Lref (points 4 and 5) following 7 strain-softening stretches to 133% Lref (point 2). The second (points 8 and 11) and third pairs (points 13 and 16) measured the amount of Tp restored by two 1-min KCl-induced contractions at 100% Lref (points 9 and 10 and points 14 and 15), also following 7 strain-softening stretches to 133% Lref (points 7 and 12, respectively), with the final pair of contractions inhibited by 1 μM staurosporine. B: increase in Tp at Lref due to 2 contractions at 50% Lref, 2 contractions at 100% Lref, and 2 contractions at 100% Lref inhibited by 1 μM staurosporine. Data were normalized to the increase due to the 2 contractions at 50% Lref. Values are means ± SE (n = 5). *P < 0.05 indicates a significant difference compared with 1.0. ΩP < 0.05 indicates that the increase in Tp was significantly less following 2 contractions at 100% Lref with staurosporine compared with those without staurosporine.
Fig. 5.
Fig. 5.
A: protocol to determine whether a “voiding-like” contraction (VLC) followed by 15 min of rhythmic contraction (RC) causes regeneration of APS. After the determination of Lref (Fig. 1B), 3 pairs of Tp measurements were made at Lref (shaded bars) while in 0 Ca, as in the previous protocols (Fig. 3A). The first and third pairs measured the amount of Tp restored by two 1-min KCl-induced contractions at 50% Lref (points 4 and 5 and points 13 and 14) following 7 strain-softening stretches to 133% Lref (open bars). The second pair of Tp measurements (points 8 and 10) measured the amount of Tp restored by a VLC (point 8, arrow) plus 15 min in PSS with or without induced RC at 50% Lref (point 9). B: Tp increase at Lref due to the following: 2 contractions, 1 VLC plus 15 min RC induced with PGE2 (SC-560+PGE2), 1 VLC plus 15 min RC induced with carbachol (SC-560+CCh), and 1 VLC plus 15 min in PSS with RC abolished by SC-560 (SC-560). Data were normalized to the increase due to 2 contractions. Values are means ± SE (n = 3 or 4). *P < 0.05 indicates a significant difference compared with 1.0. C: selected data from 1 experiment showing induced RC due to either PGE2 or CCh and the absence of RC due to SC-560. Data are normalized to peak Ta of the first contraction (Ta_1).
Fig. 6.
Fig. 6.
A: protocol to determine whether a VLC or 15 min of RC causes regeneration of APS. After the determination of Lref (Fig. 1B), 3 pairs of Tp measurements were made at Lref (shaded bars) while in 0 Ca, as in the previous protocols (Figs. 3A and 5A). The first pair measured the amount of Tp restored by two 1-min KCl-induced contractions at 50% Lref (points 4 and 5) following 7 strain-softening stretches to 133% Lref (open bars). The second pair of Tp measurements (points 8 and 10) measured the amount of Tp restored by a VLC (point 8, arrow), and the third pair measured the amount of Tp restored by 15 min of PGE2-induced RC at 50% Lref (point 13). B: Tp increase at Lref due to 2 contractions, VLC, or 15-min RC induced with PGE2. Data were normalized to the increase due to 2 contractions. Values are means ± SE (n = 4). *P < 0.05 indicates a significant difference compared with 1.0.
Fig. 7.
Fig. 7.
A: protocol to determine whether APS restored following incubation in 0 Ca is inhibited by 1 μM staurosporine. After the determination of Lref (Fig. 1B), 4 pairs of Tp measurements were made at Lref (shaded bars) while in 0 Ca, as in the previous protocols (Figs. 3A and 5A). The first and fourth pairs measured the amount of Tp restored by two 1-min KCl-induced contractions at 50% Lref (points 4 and 5 and points 17 and 18) following 7 strain-softening stretches to 133% Lref (open bars). The second pair of Tp measurements (points 8 and 10) measured the amount of Tp restored by 15 min in 0 Ca at 50% Lref (point 9), and the third pair of Tp measurements (points 12 and 14) measured the amount of Tp restored by 15 min in 0 Ca plus 1 μM staurosporine at 50% Lref (point 13, arrow). B: Tp increase at Lref due to the following: 2 contractions, 15 min in 0 Ca, or 15 min in 0 Ca plus 1 μM staurosporine. Data were normalized to the increase due to 2 contractions. Values are means ± SE (n = 4). *P < 0.05 indicates a significant difference compared with 1.0. ΩP < 0.025 indicates that the increase in Tp was significantly less following incubation in 0 Ca with staurosporine compared with that without staurosporine.
Fig. 8.
Fig. 8.
Summary of the normalized increases in Tp at Lref following selected stimuli at 50% Lref for the protocols used in this study. Values are normalized to the increase in Tp following 2 maximal 1-min KCl-induced contractions. *P < 0.05 indicates a significant difference compared with 1.0.

Similar articles

Cited by

References

    1. Anderson KE, Arner A. Urinary bladder contraction and relaxation: physiology and pathophysiology. Physiol Rev 84: 935–986, 2004 - PubMed
    1. Bai TR, Bates JH, Brusasco V, Camoretti-Mercado B, Chitano P, Deng LH, Dowell M, Fabry B, Ford LE, Fredberg JJ, Gerthoffer WT, Gilbert SH, Gunst SJ, Hai CM, Halayko AJ, Hirst SJ, James AL, Janssen LJ, Jones KA, King GG, Lakser OJ, Lambert RK, Lauzon AM, Lutchen KR, Maksym GN, Meiss RA, Mijailovich SM, Mitchell HW, Mitchell RW, Mitzner W, Murphy TM, Paré PD, Schellenberg RR, Seow CY, Sieck GC, Smith PG, Smolensky AV, Solway J, Stephens NL, Stewart AG, Tang DD, Wang L. On the terminology for describing the length-force relationship and its changes in airway smooth muscle. J Appl Physiol 97: 2029–2034, 2004 - PubMed
    1. Biers SM, Reynard JM, Doore T, Brading AF. The functional effects of a c-kit tyrosine inhibitor on guinea-pig and human detrusor. BJU Int 97: 612–616, 2006 - PubMed
    1. Bossé Y, Sobieszek A, Pare PD, Seow CY. Length adaptation of airway smooth muscle. Proc Am Thorac Soc 5: 62–67, 2008 - PubMed
    1. Brading AF. A myogenic basis for the overactive bladder. Urology 50: 57–67, 1997 - PubMed

Publication types

MeSH terms

LinkOut - more resources