

Feasibility of one-shot-per-crystal structure determination using Laue diffraction
- PMID: 20057043
- PMCID: PMC2803125
- DOI: 10.1107/S0907444909037731
Feasibility of one-shot-per-crystal structure determination using Laue diffraction
Abstract
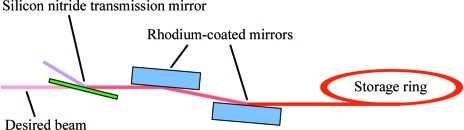
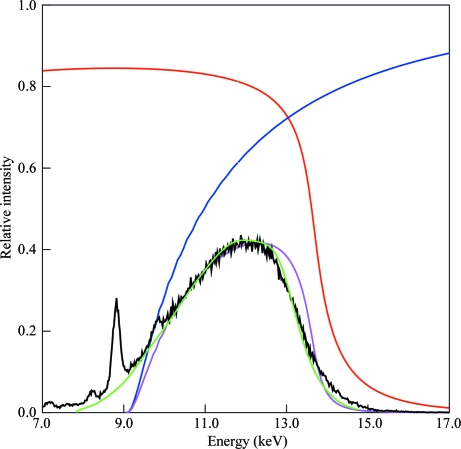
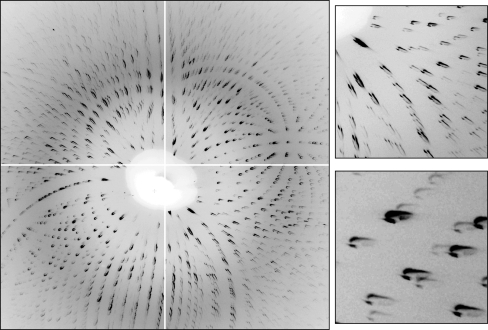
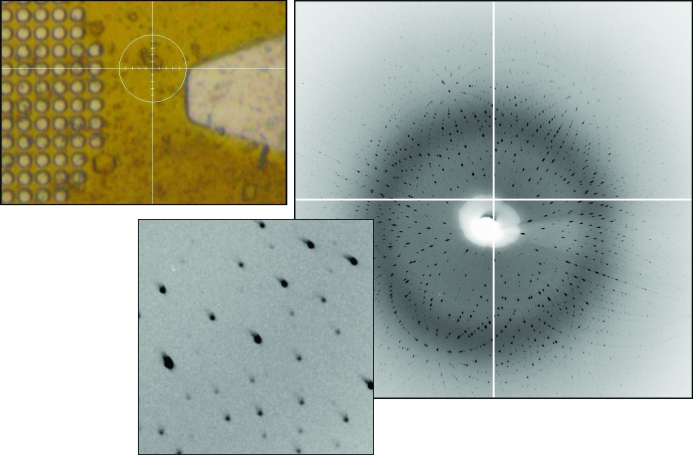
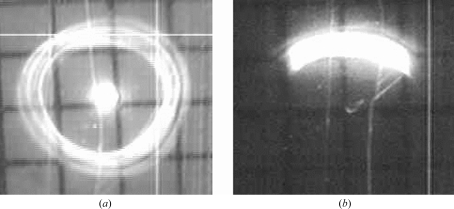
Crystal size is an important factor in determining the number of diffraction patterns which may be obtained from a protein crystal before severe radiation damage sets in. As crystal dimensions decrease this number is reduced, eventually falling to one, at which point a complete data set must be assembled using data from multiple crystals. When only a single exposure is to be collected from each crystal, the polychromatic Laue technique may be preferable to monochromatic methods owing to its simultaneous recording of a large number of fully recorded reflections per image. To assess the feasibility of solving structures using single Laue images from multiple crystals, data were collected using a 'pink' beam at the CHESS D1 station from groups of lysozyme crystals with dimensions of the order of 20-30 microm mounted on MicroMesh grids. Single-shot Laue data were used for structure determination by molecular replacement and correct solutions were obtained even when as few as five crystals were used.
Figures
Similar articles
-
Identification of dislocations in large tetragonal hen egg-white lysozyme crystals by synchrotron white-beam topography.J Synchrotron Radiat. 2003 Nov 1;10(Pt 6):416-20. doi: 10.1107/s0909049503020417. Epub 2003 Oct 10. J Synchrotron Radiat. 2003. PMID: 14551440
-
Energy resolution of the CdTe-XPAD detector: calibration and potential for Laue diffraction measurements on protein crystals.J Synchrotron Radiat. 2012 May;19(Pt 3):323-31. doi: 10.1107/S0909049512004463. Epub 2012 Mar 15. J Synchrotron Radiat. 2012. PMID: 22514165
-
In-house low-resolution X-ray crystallography.Acta Crystallogr D Biol Crystallogr. 2000 Oct;56(Pt 10):1304-11. doi: 10.1107/s0907444900008982. Acta Crystallogr D Biol Crystallogr. 2000. PMID: 10998626
-
Protein crystal perfection and its application.Acta Crystallogr D Biol Crystallogr. 2005 Jun;61(Pt 6):793-8. doi: 10.1107/S0907444905001368. Epub 2005 May 26. Acta Crystallogr D Biol Crystallogr. 2005. PMID: 15930642 Review.
-
A general method for hyperquenching protein crystals.J Struct Funct Genomics. 2007 Dec;8(4):141-4. doi: 10.1007/s10969-007-9029-0. Epub 2007 Oct 19. J Struct Funct Genomics. 2007. PMID: 17952628 Free PMC article. Review.
Cited by
-
Advancing macromolecular structure determination with microsecond X-ray pulses at a 4th generation synchrotron.Commun Chem. 2025 Jan 7;8(1):6. doi: 10.1038/s42004-024-01404-y. Commun Chem. 2025. PMID: 39775172 Free PMC article.
-
Serial snapshot crystallography for materials science with SwissFEL.IUCrJ. 2015 Apr 21;2(Pt 3):361-70. doi: 10.1107/S2052252515006740. eCollection 2015 May 1. IUCrJ. 2015. PMID: 25995845 Free PMC article.
-
In situ serial Laue diffraction on a microfluidic crystallization device.J Appl Crystallogr. 2014 Nov 18;47(Pt 6):1975-1982. doi: 10.1107/S1600576714023322. eCollection 2014 Dec 1. J Appl Crystallogr. 2014. PMID: 25484843 Free PMC article.
-
Coherent convergent-beam time-resolved X-ray diffraction.Philos Trans R Soc Lond B Biol Sci. 2014 Jul 17;369(1647):20130325. doi: 10.1098/rstb.2013.0325. Philos Trans R Soc Lond B Biol Sci. 2014. PMID: 24914153 Free PMC article.
-
Towards time-resolved serial crystallography in a microfluidic device.Acta Crystallogr F Struct Biol Commun. 2015 Jul;71(Pt 7):823-30. doi: 10.1107/S2053230X15009061. Epub 2015 Jun 27. Acta Crystallogr F Struct Biol Commun. 2015. PMID: 26144226 Free PMC article.
References
-
- Arzt, S., Campbell, J. W., Harding, M. M., Hao, Q. & Helliwell, J. R. (1999). J. Appl. Cryst.32, 554–562.
-
- Berman, H., Henrick, K. & Nakamura, H. (2003). Nature Struct. Mol. Biol.10, 980. - PubMed
-
- Bilderback, D. H., Hoffman, S. A. & Thiel, D. J. (1994). Science, 263, 201–203. - PubMed
-
- Bilderback, D. H., Moffat, K. & Szebenyi, D. M. E. (1984). Nucl. Instrum. Methods Phys. Res. A, 222, 245–251.
-
- Bilderback, D. H., Sinclair, C. & Gruner, S. M. (2006). Synchrotron Rad. News, 19(6), 30–35.
Publication types
MeSH terms
Substances
Grants and funding
LinkOut - more resources
Full Text Sources
Research Materials
