

Longitudinal modelling of body mass index from birth to 14 years
- PMID: 20057197
- PMCID: PMC6515912
- DOI: 10.1159/000235561
Longitudinal modelling of body mass index from birth to 14 years
Abstract
Background: To examine the tracking of BMI from birth to age 14 years.
Participants and methods: Linear mixed model (LMM) analysis was used to model the trajectories of BMI (n = 1,403). Adiposity rebound was investigated for a subset of individuals (n = 173).
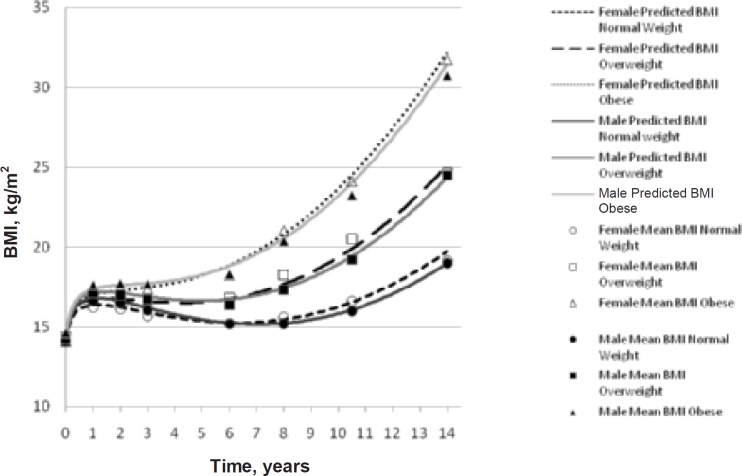
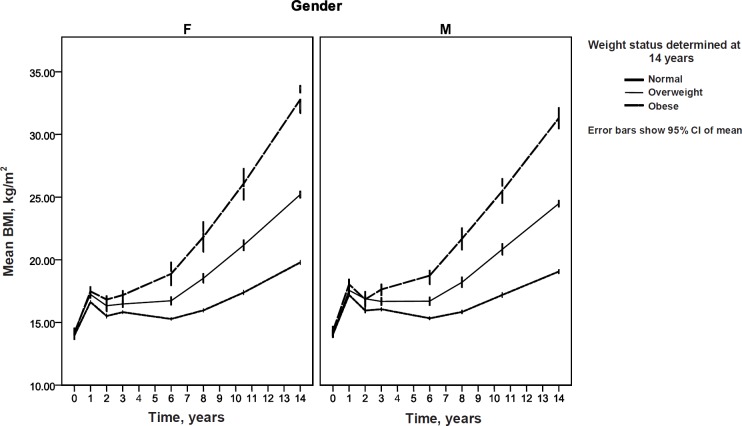
Results: Adolescents who were overweight or obese at 14 years followed a different BMI trajectory from birth compared to those of normal weight. There was a difference between weight status groups for the timing of adiposity rebound (p < 0.001) and BMI at nadir (p < 0.001). The LMM depicted a significant difference in rate of change of BMI over time for males and females (p < 0.001), with female BMI increasing at a faster rate, and for weight status groups (p < 0.005), with the obese cohort having the faster increase in BMI over time. BMI at birth was significantly lower for the normal weight cohort compared to the overweight (p = 0.029) and obese (p = 0.019) cohorts.
Conclusion: This study introduces a powerful analytic tool, LMM, to model BMI and shows that weight status at 14 years is the result of a distinct path in earlier years. Compared to their normal weight peers, overweight and obese adolescents experience an earlier adiposity rebound, with a higher BMI at rebound.
Figures
Similar articles
-
Childhood body mass index trajectories: modeling, characterizing, pairwise correlations and socio-demographic predictors of trajectory characteristics.BMC Med Res Methodol. 2012 Mar 29;12:38. doi: 10.1186/1471-2288-12-38. BMC Med Res Methodol. 2012. PMID: 22458308 Free PMC article.
-
Age at adiposity rebound and body mass index trajectory from early childhood to adolescence; differences by breastfeeding and maternal immigration background.Pediatr Obes. 2017 Feb;12(1):75-84. doi: 10.1111/ijpo.12111. Epub 2016 Feb 22. Pediatr Obes. 2017. PMID: 26910193
-
Trajectory of body mass index and height changes from childhood to adolescence: a nationwide birth cohort in Japan.Sci Rep. 2021 Nov 26;11(1):23004. doi: 10.1038/s41598-021-02464-z. Sci Rep. 2021. PMID: 34837002 Free PMC article.
-
Premature Birth is an Independent Risk Factor for Early Adiposity Rebound: Longitudinal Analysis of BMI Data from Birth to 7 Years.Nutrients. 2020 Nov 27;12(12):3654. doi: 10.3390/nu12123654. Nutrients. 2020. PMID: 33261215 Free PMC article.
-
Offspring body size and metabolic profile - effects of lifestyle intervention in obese pregnant women.Dan Med J. 2014 Jul;61(7):B4893. Dan Med J. 2014. PMID: 25123127 Review.
Cited by
-
A Longitudinal Study of Road Traffic Noise and Body Mass Index Trajectories from Birth to 8 Years.Epidemiology. 2018 Sep;29(5):729-738. doi: 10.1097/EDE.0000000000000868. Epidemiology. 2018. PMID: 29927819 Free PMC article.
-
Bayesian hierarchical piecewise regression models: a tool to detect trajectory divergence between groups in long-term observational studies.BMC Med Res Methodol. 2017 Jun 6;17(1):86. doi: 10.1186/s12874-017-0358-9. BMC Med Res Methodol. 2017. PMID: 28587592 Free PMC article.
-
Obesity-related hypertension: pathogenesis, cardiovascular risk, and treatment: a position paper of The Obesity Society and the American Society of Hypertension.J Clin Hypertens (Greenwich). 2013 Jan;15(1):14-33. doi: 10.1111/jch.12049. Epub 2012 Dec 18. J Clin Hypertens (Greenwich). 2013. PMID: 23282121 Free PMC article. Review.
-
Associations of the infancy body mass index peak with anthropometry and cardiometabolic risk in Mexican adolescents.Ann Hum Biol. 2018 Aug;45(5):386-394. doi: 10.1080/03014460.2018.1506048. Epub 2018 Oct 17. Ann Hum Biol. 2018. PMID: 30328713 Free PMC article.
-
GWAS on longitudinal growth traits reveals different genetic factors influencing infant, child, and adult BMI.Sci Adv. 2019 Sep 4;5(9):eaaw3095. doi: 10.1126/sciadv.aaw3095. eCollection 2019 Sep. Sci Adv. 2019. PMID: 31840077 Free PMC article.
References
-
- Australian Institute of Health and Welfare: Australia's health 2006 AIHW Cat. No. AUS 73. Canberra, Australian Institute of Health and Welfare. 2006
-
- Haslam DW, James WPT. Obesity. Lancet. 2005;366:1197–1209. - PubMed
-
- World Health Organisation: Obesity and overweight Fact Sheet No. 311. 2006 www.who.int/mediacentre/factsheets/fs311/en/print.html.
-
- National Health and Medical Research Council: Clinical practice guidelines for the management of overweight and obesity in children and adolescents Canberra, Commonwealth of Australia. 2003 www.health.gov.au/internet/main/publishing.nsf/Content/893169B10DD846FCC....
Publication types
MeSH terms
LinkOut - more resources
Full Text Sources
Medical
