

Nonparametric Signal Extraction and Measurement Error in the Analysis of Electroencephalographic Activity During Sleep
- PMID: 20057925
- PMCID: PMC2802498
- DOI: 10.1198/jasa.2009.0020
Nonparametric Signal Extraction and Measurement Error in the Analysis of Electroencephalographic Activity During Sleep
Abstract
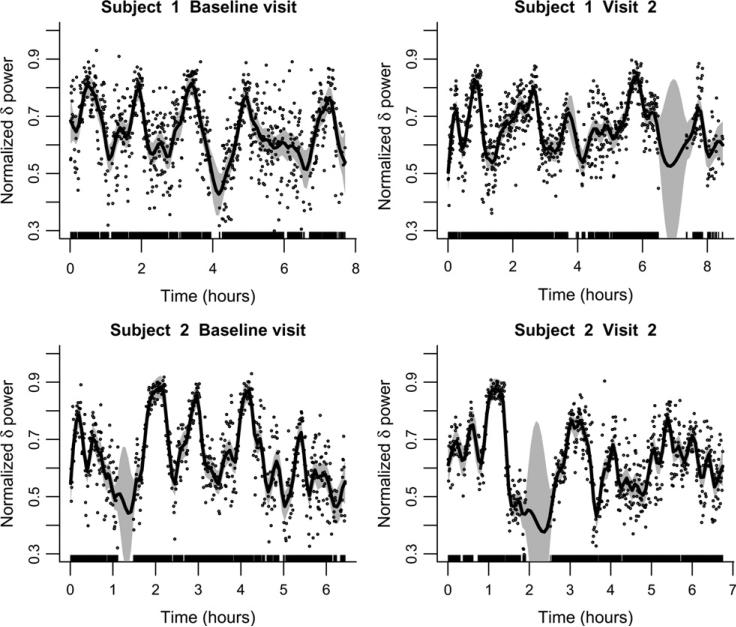
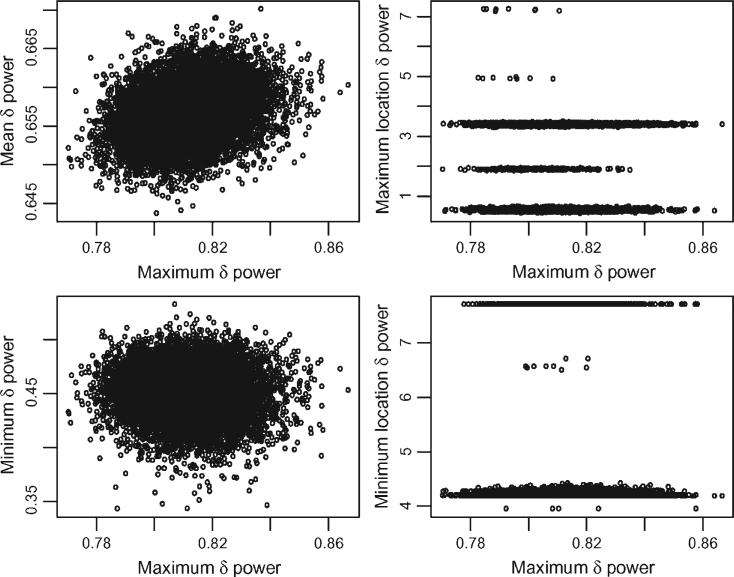
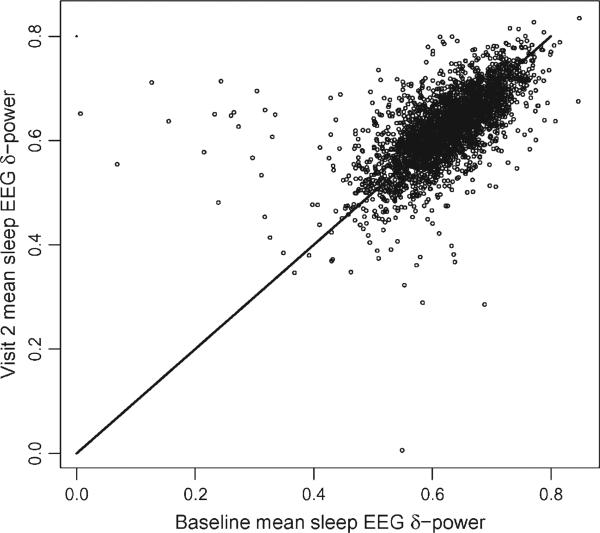
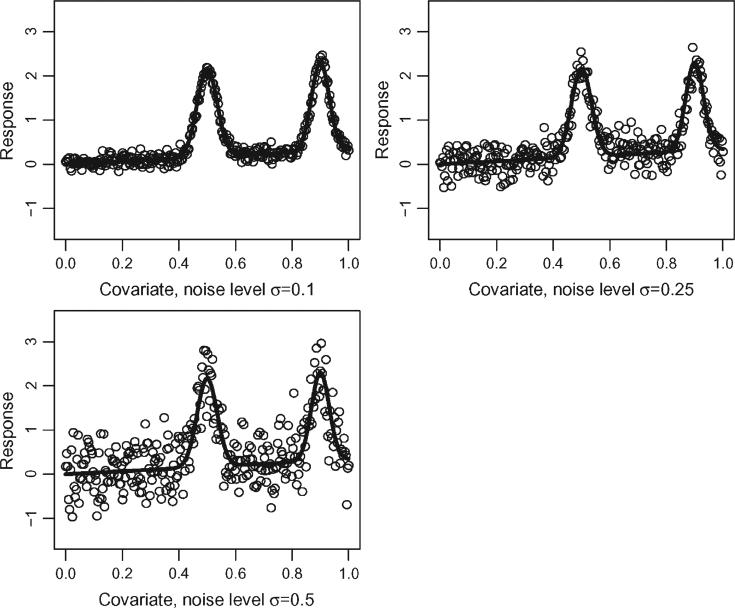
We introduce methods for signal and associated variability estimation based on hierarchical nonparametric smoothing with application to the Sleep Heart Health Study (SHHS). SHHS is the largest electroencephalographic (EEG) collection of sleep-related data, which contains, at each visit, two quasi-continuous EEG signals for each subject. The signal features extracted from EEG data are then used in second level analyses to investigate the relation between health, behavioral, or biometric outcomes and sleep. Using subject specific signals estimated with known variability in a second level regression becomes a nonstandard measurement error problem. We propose and implement methods that take into account cross-sectional and longitudinal measurement error. The research presented here forms the basis for EEG signal processing for the SHHS.
Figures
References
-
- Akerstedt T, Kecklund G, Knutsson A. Manifest Sleepiness and the Spectral Content of the EEG During Shift Work. Sleep. 1991;14:221–225. - PubMed
-
- Bowman AW, Jones MC, Gijbels I. Testing Monotonicity of Regression. Journal of Computational and Graphical Statistics. 1998;7:489–500.
-
- Brumback B, Rice JA. Smoothing Spline Models for the Analysis of Nested and Crossed Samples of Curves. Journal of the American Statistical Association. 1998;93:961–994. with discussion.
-
- Carrier J, Land S, Buysse DJ, Kupfer DJ, Monk TH. The Effects of Age and Gender on Sleep EEG Power Spectral Density in the Middle Years of Life (Ages 20–60 Years Old) Psychophysiology. 2001;38:232–242. - PubMed
-
- Carroll RJ, Kuchenhoff H, Lombard F, Stefanski LA. Asymptotics for the SIMEX Estimator in Nonlinear Measurement Error Models. Journal of the American Statistical Association. 1996;91:242–245.
Publication types
Grants and funding
LinkOut - more resources
Full Text Sources