

A defined network of fast-spiking interneurons in orbitofrontal cortex: responses to behavioral contingencies and ketamine administration
- PMID: 20057934
- PMCID: PMC2802551
- DOI: 10.3389/neuro.06.013.2009
A defined network of fast-spiking interneurons in orbitofrontal cortex: responses to behavioral contingencies and ketamine administration
Abstract
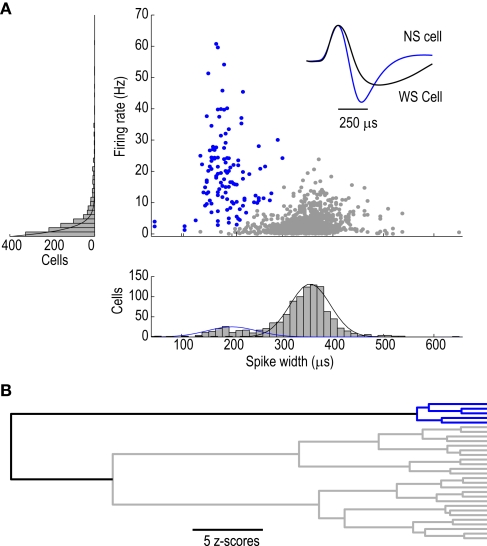
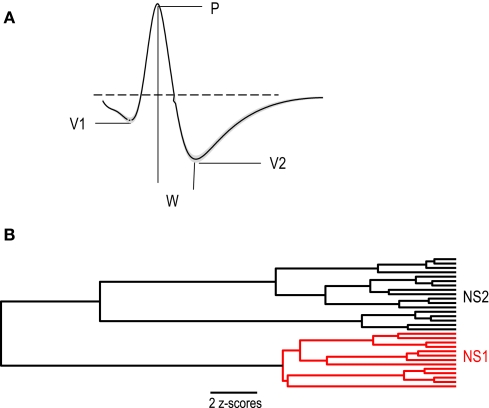
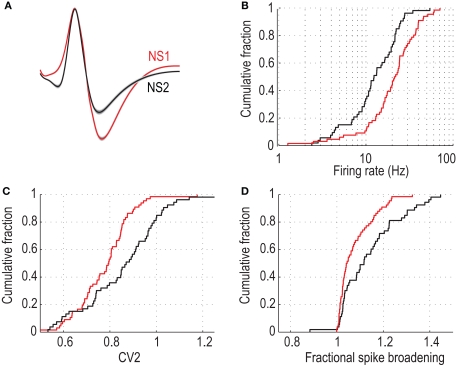
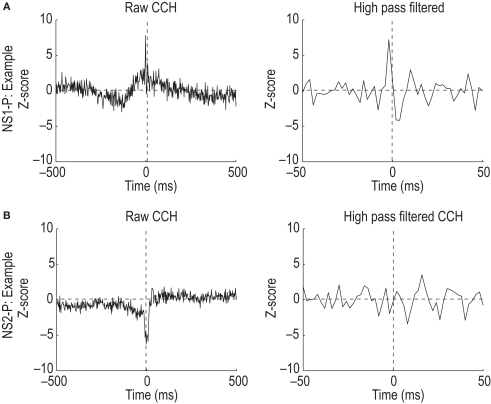
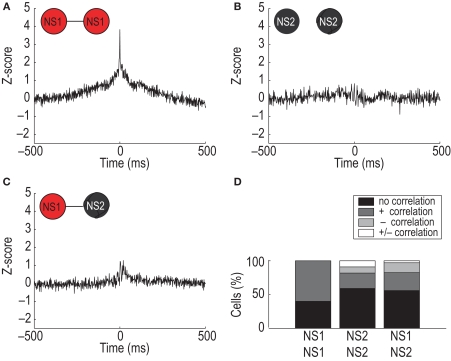
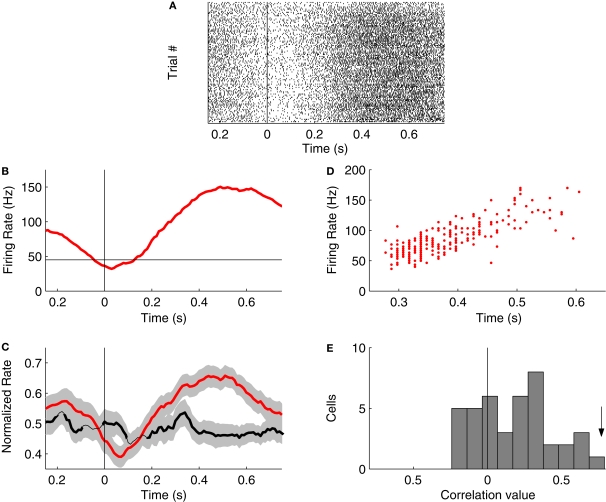
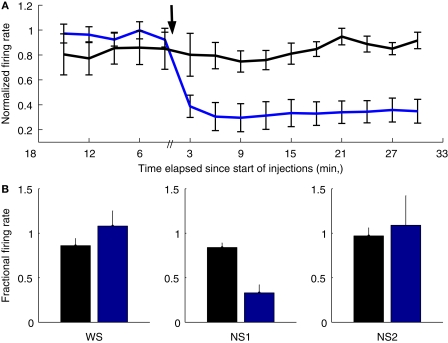
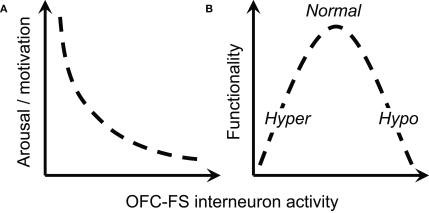
Orbitofrontal cortex (OFC) is a region of prefrontal cortex implicated in the motivational control of behavior and in related abnormalities seen in psychosis and depression. It has been hypothesized that a critical mechanism in these disorders is the dysfunction of GABAergic interneurons that normally regulate prefrontal information processing. Here, we studied a subclass of interneurons isolated in rat OFC using extracellular waveform and spike train analysis. During performance of a goal-directed behavioral task, the firing of this class of putative fast-spiking (FS) interneurons showed robust temporal correlations indicative of a functionally coherent network. FS cell activity also co-varied with behavioral response latency, a key indicator of motivational state. Systemic administration of ketamine, a drug that can mimic psychosis, preferentially inhibited this cell class. Together, these results support the idea that OFC-FS interneurons form a critical link in the regulation of motivation by prefrontal circuits during normal and abnormal brain and behavioral states.
Keywords: depression; fast-spiking interneuron; motivation; parvalbumin; psychosis; schizophrenia.
Figures
Similar articles
-
A Novel Multisensory Integration Task Reveals Robust Deficits in Rodent Models of Schizophrenia: Converging Evidence for Remediation via Nicotinic Receptor Stimulation of Inhibitory Transmission in the Prefrontal Cortex.J Neurosci. 2016 Dec 14;36(50):12570-12585. doi: 10.1523/JNEUROSCI.1628-16.2016. J Neurosci. 2016. PMID: 27974613 Free PMC article.
-
In vivo modulation of the firing activity of putative slow- and fast-spiking interneurons in the medial prefrontal cortex by 5-HT3 receptors in 6-hydroxydopamine-induced Parkinsonian rats.Neuroscience. 2010 Sep 1;169(3):1315-25. doi: 10.1016/j.neuroscience.2010.05.059. Epub 2010 Jun 4. Neuroscience. 2010. PMID: 20576497
-
Structural alterations in fast-spiking GABAergic interneurons in a model of posttraumatic neocortical epileptogenesis.Neurobiol Dis. 2017 Dec;108:100-114. doi: 10.1016/j.nbd.2017.08.008. Epub 2017 Aug 18. Neurobiol Dis. 2017. PMID: 28823934 Free PMC article.
-
PV Interneurons: Critical Regulators of E/I Balance for Prefrontal Cortex-Dependent Behavior and Psychiatric Disorders.Front Neural Circuits. 2018 May 16;12:37. doi: 10.3389/fncir.2018.00037. eCollection 2018. Front Neural Circuits. 2018. PMID: 29867371 Free PMC article. Review.
-
[Present contribution of neurosciences to a new clinical reading of obsessive-compulsive disorder].Encephale. 2007 Mar-Apr;33(2):203-10. doi: 10.1016/s0013-7006(07)91551-1. Encephale. 2007. PMID: 17675916 Review. French.
Cited by
-
Non-redundant odor coding by sister mitral cells revealed by light addressable glomeruli in the mouse.Nat Neurosci. 2010 Nov;13(11):1404-12. doi: 10.1038/nn.2673. Epub 2010 Oct 17. Nat Neurosci. 2010. PMID: 20953197 Free PMC article.
-
Enriched binocular experience followed by sleep optimally restores binocular visual cortical responses in a mouse model of amblyopia.Commun Biol. 2023 Apr 13;6(1):408. doi: 10.1038/s42003-023-04798-y. Commun Biol. 2023. PMID: 37055505 Free PMC article.
-
Increased burst coding in deep layers of the ventral anterior cingulate cortex during neuropathic pain.Sci Rep. 2021 Dec 20;11(1):24240. doi: 10.1038/s41598-021-03652-7. Sci Rep. 2021. PMID: 34930957 Free PMC article.
-
Ketamine decreases sensitivity of male rats to misleading negative feedback in a probabilistic reversal-learning task.Psychopharmacology (Berl). 2017 Feb;234(4):613-620. doi: 10.1007/s00213-016-4497-1. Epub 2016 Dec 8. Psychopharmacology (Berl). 2017. PMID: 27933365 Free PMC article.
-
Prefrontal cortex neurons encode ambient light intensity differentially across regions and layers.Nat Commun. 2024 Jun 29;15(1):5501. doi: 10.1038/s41467-024-49794-w. Nat Commun. 2024. PMID: 38951486 Free PMC article.
References
-
- Ascoli G. A., Alonso-Nanclares L., Anderson S. A., Barrionuevo G., Benavides-Piccione R., Burkhalter A., Buzsáki G., Cauli B., Defelipe J., Fairén A., Feldmeyer D., Fishell G., Fregnac Y., Freund T. F., Gardner D., Gardner E. P., Goldberg J. H., Helmstaedter M., Hestrin S., Karube F., Kisvárday Z. F., Lambolez B., Lewis D. A., Marin O., Markram H., Muñoz A., Packer A., Petersen C. C., Rockland K. S., Rossier J., Rudy B., Somogyi P., Staiger J. F., Tamas G., Thomson A. M., Toledo-Rodriguez M., Wang Y., West D. C., Yuste R. (2008). Petilla terminology: nomenclature of features of GABAergic neurons of the cerebral cortex. Nat. Rev. Neurosci. 9, 557–56810.1038/nrn2402 - DOI - PMC - PubMed
LinkOut - more resources
Full Text Sources