. 2010 Mar 15;518(6):741-69.
doi: 10.1002/cne.22255.

Dopamine receptors in a songbird brain

Affiliations

Dopamine receptors in a songbird brain

Lubica Kubikova et al. J Comp Neurol. .

Abstract

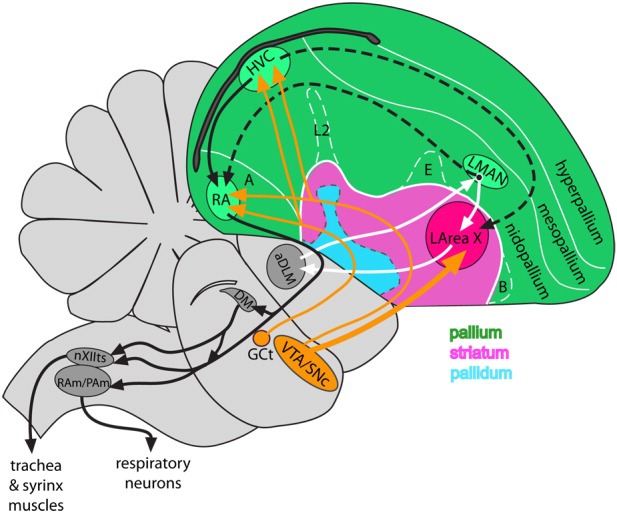
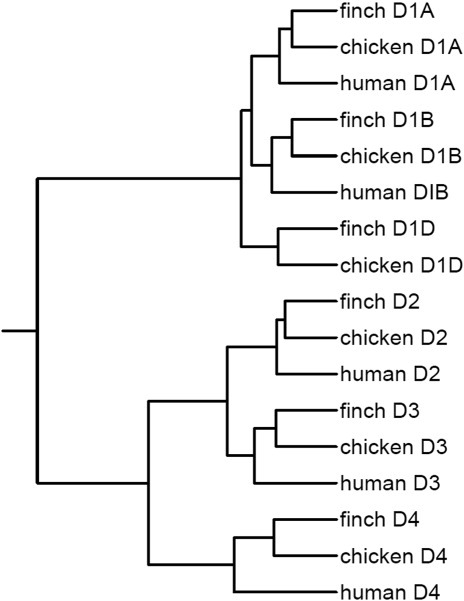
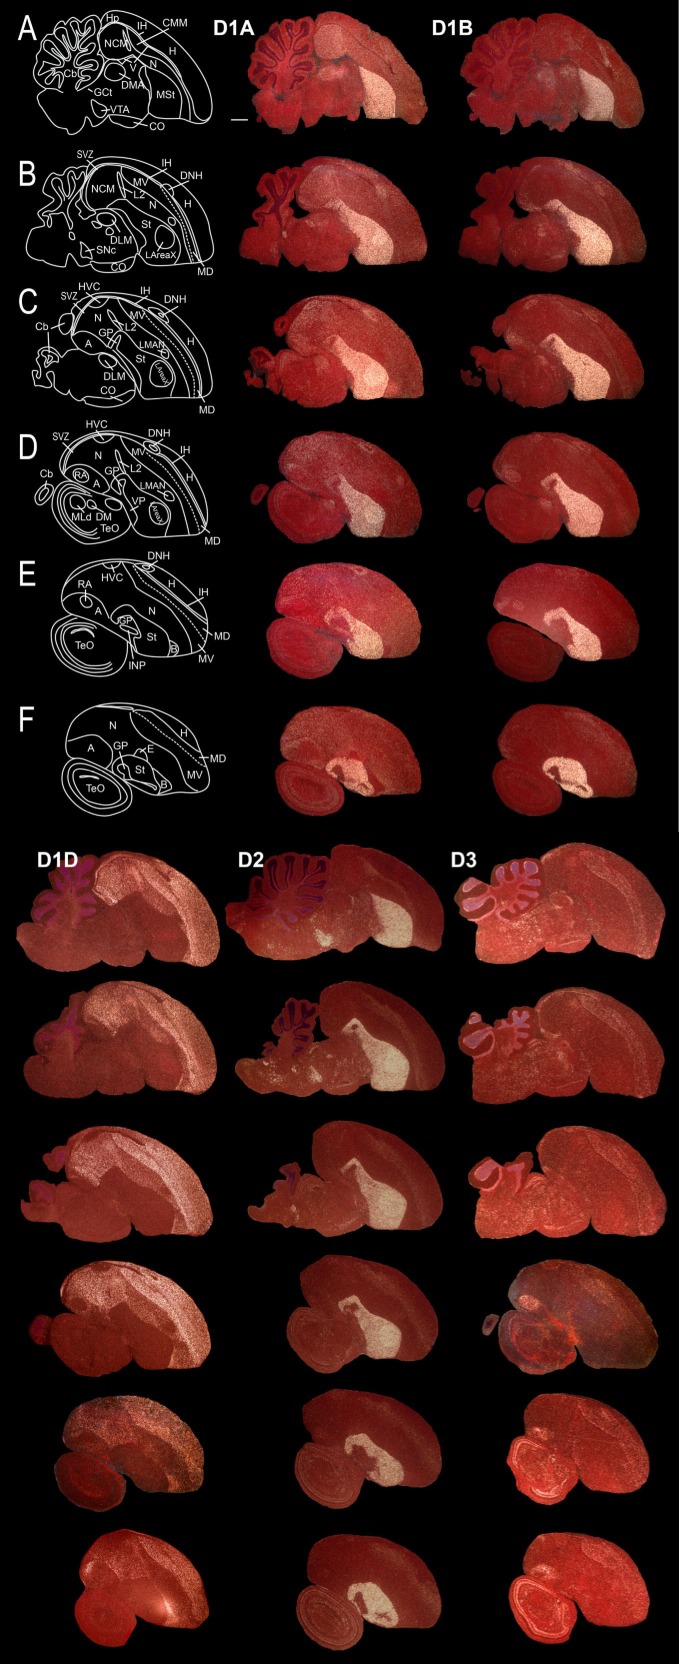
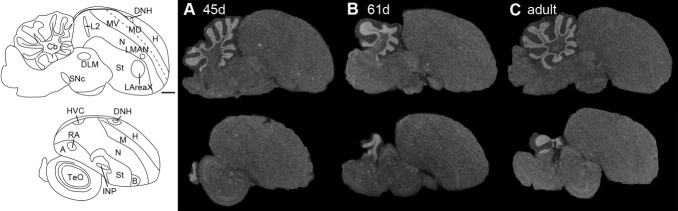
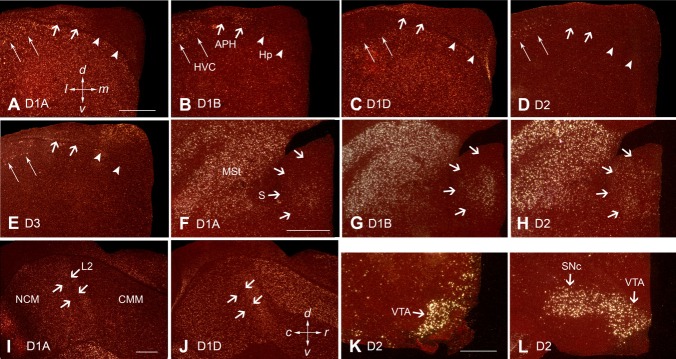
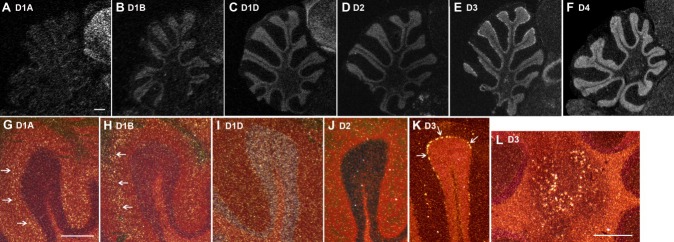
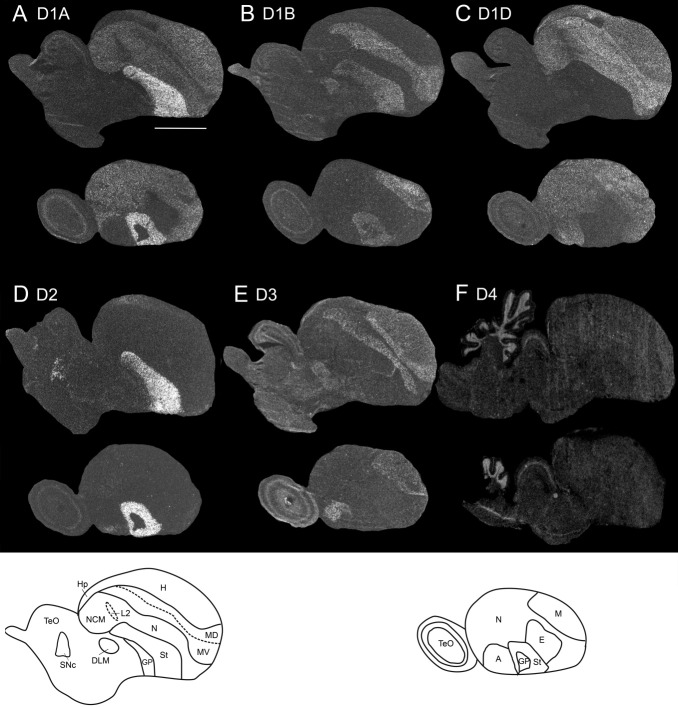
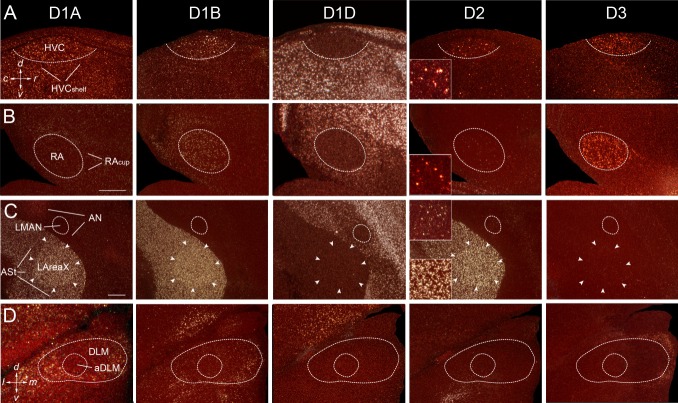
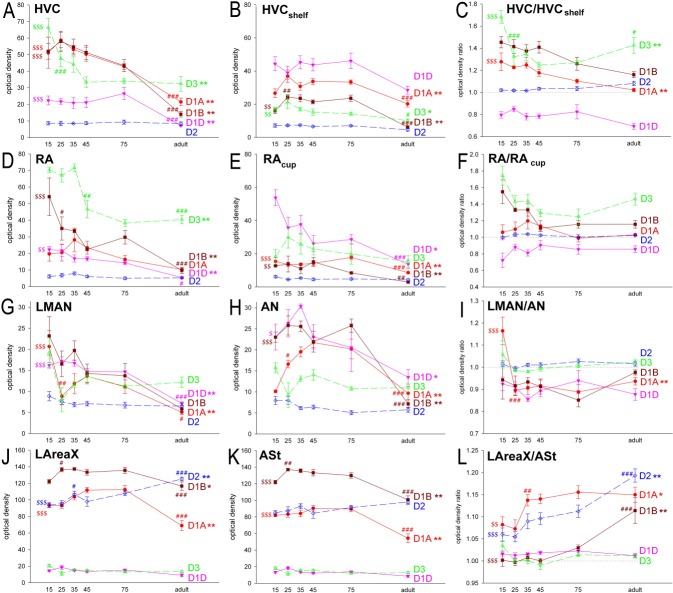
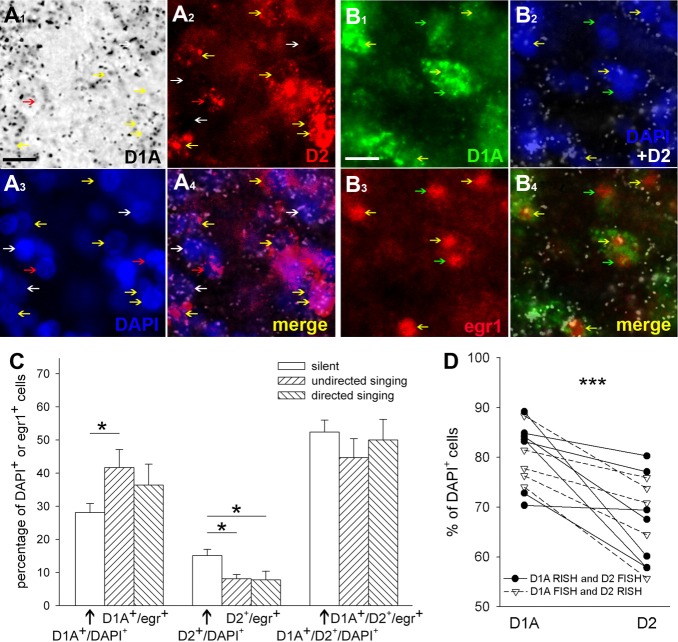
Dopamine is a key neuromodulatory transmitter in the brain. It acts through dopamine receptors to affect changes in neural activity, gene expression, and behavior. In songbirds, dopamine is released into the striatal song nucleus Area X, and the levels depend on social contexts of undirected and directed singing. This differential release is associated with differential expression of activity-dependent genes, such as egr1 (avian zenk), which in mammalian brain are modulated by dopamine receptors. Here we cloned from zebra finch brain cDNAs of all avian dopamine receptors: the D1 (D1A, D1B, D1D) and D2 (D2, D3, D4) families. Comparative sequence analyses of predicted proteins revealed expected phylogenetic relationships, in which the D1 family exists as single exon and the D2 family exists as spliced exon genes. In both zebra finch and chicken, the D1A, D1B, and D2 receptors were highly expressed in the striatum, the D1D and D3 throughout the pallium and within the mesopallium, respectively, and the D4 mainly in the cerebellum. Furthermore, within the zebra finch, all receptors, except for D4, showed differential expression in song nuclei relative to the surrounding regions and developmentally regulated expression that decreased for most receptors during the sensory acquisition and sensorimotor phases of song learning. Within Area X, half of the cells expressed both D1A and D2 receptors, and a higher proportion of the D1A-only-containing neurons expressed egr1 during undirected but not during directed singing. Our findings are consistent with hypotheses that dopamine receptors may be involved in song development and social context-dependent behaviors.


Figures

Figure 1
Figure 1
Diagram of the avian brain highlighting pallial, striatal, and pallidal telencephalic areas and the song system of songbirds. Black arrows, posterior vocal pathway; white arrows, anterior vocal pathway; dashed arrows, connections between the two pathways; orange arrows, dopaminergic (GCt and VTA-SNc) input into the song nuclei. For abbreviations see list.
Figure 2
Figure 2
General structure and sequence comparisons of the six zebra finch dopamine receptors relative the homologous receptors in chicken and human. A–F: For each receptor, the size and position of the cloned zebra finch cDNA fragment (top solid blue lines) aligned to the predicted exon coding (blue open bars) and intron noncoding (black lines) sequence of the zebra finch genome are shown. Asterisk indicates a stop codon. The D1 genes have one coding exon each, D2 has eight, D3 has six, and D4 has four. Below the chromosomal sequences are comparisons of the genome-predicted or mRNA-derived protein coding sequences among zebra finch (turquoise), chicken (green), and human (orange bars). The percentage values indicate percentage identities between zebra finch and chicken or zebra finch and human. The lighter blue 5′ end of the zebra finch D1B protein indicates that this region has not been sequenced yet in the genome but is expected to be present because of the sequence found in the chicken and human genomes. The D4 zebra finch cDNA clone spans the full-length coding region, but the accession number refers to the 687 bp of cDNA sequence obtained to date; the remaining sequence is inferred from the zebra finch genome. White bars represent deletions (del); darker colored bars represent nonhomologous alternate sequences (alt seq). The predicted zebra finch proteins are those that we generated and curated with GENESCAN and the UCSC genome browser. We further curated the predicted ENSEMBLE chicken D3 protein sequence, becauise it had 300 more 5′ a.a. than all other D3 proteins in the database, which we believe was a computational error. Detailed protein alignments are shown in Supporting Information Figure 1. CL3, cytoplasmatic loop 3; EL2, extracellular loop 2.
Figure 3
Figure 3
Phylogenetic analyses of dopamine receptors in the zebra finch, chicken, and human. Shown is a phylogram generated with the full-length protein coding sequences (Supp. Info. Fig. 1), the dialign alignments (http://bibiserv.techfak.uni-bielefeld.de/dialign/submission.html), and the iTOL tree-generating software (http://itol.embl.de/). For D2 and D3, variant 1 sequences were used. Branch lengths represent evolutionary time separating gene relationships (longer branch, more time). The D1 family has shorter branch lengths, indicating that they are probably more closely related than the D2 family. All receptor types show closer homologies to each other across species than they do to other receptor types within species.
Figure 4
Figure 4
Expression profiles of dopamine receptor types in sagittal series from adult male zebra finch brain. A–F: Rows showing medial to lateral series across two pages of this report with the respective drawings on the left. Columns are labeled on the top for each receptor (D4 pattern is shown separately in Fig. 6). The images were taken under darkfield microscopy. White silver grains, dopamine receptor mRNA expression; red, cresyl violet stain. Rostral is right, dorsal is upward. The sequences of the cDNA probes used are in Genbank (accession Nos. AB372107, AB372108, AB372109, AB3490795, AB327111, for D1A, D1B, D1D, D2 transcript variant 1, and D3 respectively; Table 1). Scale bar = 1 mm.
Figure 5
Figure 5
Expression profiles of dopamine receptor types in frontal series of sections of one brain hemisphere of an adult male zebra finch. A–K: Rows showing rostral to caudal series with the corresponding drawings on the left. Columns are labeled on the top for each receptor. The images were taken under darkfield microscopy. White silver grains, dopamine receptor mRNA expression; red, cresyl violet stain. Dorsal is upward, medial is right. Scale bar = 1 mm.
Figure 6
Figure 6
Expression profile of the D4 dopamine receptor in the sagittal plane from male zebra finch brains during two developmental ages in days (d; A,B) and in adulthood (C). Images were taken from film autoradiograms and inverted. Only several sections are shown, because there was not much differential expression of D4 receptor in the telencephalon. White, dopamine receptor mRNA expression. Dorsal is upward, rostral is right. Genbank accession number of probe sequence is GQ359780 (Table 1). Scale bar = 1 mm.
Figure 7
Figure 7
Higher power images of differential dopamine receptor subtype expression in specific zebra finch brain regions. A–E: Hippocampal formation. F–H: Septum. I,J: Field L2, NCM, and CMM. K,L: Midbrain dopaminergic cell groups VTA and SNc. Arrowheads in A–E point to the ventricle. All sections are coronal, except for I and J, which are sagittal. White silver grains, dopamine receptor mRNA expression; red, cresyl violet stain. Scale bars = 0.5 mm in A (applies to A–E); 0.5 mm in F (applies to F–H); 0.5 mm in I (applies to I,J); 0.5 mm in K (applies to K,L).
Figure 8
Figure 8
Higher power images of differential dopamine receptor subtype expression in the cerebellum. A–F show film autoradiogram images that were inverted, where expression can be seen in the granular layer for all receptors; the Nissl staining of the dense granular layer in the in situ hybridizations masks the label. G–L show Nissl-stained images in darkfield, in which the differential expression (white silver grains) of several receptors (D1A, D1B, and D3) can be seen in the inner and outer halves of the molecular layer and in Purkinje cells, respectively (arrows). Scale bars = 0.25 mm in A (applies to A–F); 0.25 mm in G (applies to G–K); 0.25 mm in L.
Figure 9
Figure 9
Expression profiles of dopamine receptor subtypes in adult chicken brain. Images were taken from film autoradiograms and inverted; white, mRNA signal. Two sagittal sections are shown per receptor; the distance from the midline is ∼1.5 (top) and 3.5 mm (bottom). A–C show the D1 receptor family (D1A, D1B, and D1D). D–F show the D2 receptor family (D2, D3, and D4). The hybridizations were done with the zebra finch 35S-UTP-labeled cRNA riboprobes using the same high-stringency conditions as for the zebra finch in situ hybridizations. Scale bar = 0.5 cm.
Figure 10
Figure 10
A–D: Higher power images of differential expression of different dopamine receptor subtypes in the song nuclei HVC, RA, LMAN, LAreaX, and aDLM of an adult male zebra finch. Insets for the D2 receptor show higher power images of isolated labeled cells in pallial song nuclei (HVC, RA, LMAN); inset for LArea X is shown for comparison. All sections are sagittal except for the last row, showing aDLM, which is coronal. White silver grains, dopamine receptor mRNA expression; red, cresyl violet stain. Scale bars = 0.5 mm (insets magnified ×2.7 more).
Figure 11
Figure 11
Quantification of the expression levels of the dopamine receptors in the song nuclei HVC, RA, LMAN, and LAreaX relative to their surrounding brain regions of HVCshelf, RAcup, AN, and ASt in adult male zebra finches. Each bar represents mean ± SEM measured from film autoradiograms. Statistical analysis was done by paired t-test where the ratio was compared with a ratio equal 1. *P < 0.05, **P < 0.01, ***P < 0.001.
Figure 12
Figure 12
Images of differential dopamine receptor subtype expression in the song nuclei during development. A: D1A receptors in HVC. B: D3 in HVC. C: D3 in RA. D–F: D1A, D1B, and D2 in LArea X and LMAN, respectively. The age of each bird in days is labeled in the top right corner of each image. All sections are sagittal. The images were taken from film autoradiograms. Black, mRNA signal. Scale bars = 0.5 mm in A (applies to A–C); 0.5 mm in D (applies to D–F).
Figure 13
Figure 13
Quantification of dopamine receptor subtype expression in the song nuclei (A,D,G,J), surrounding areas (B,E,H,K), and their ratios (C,F,I,L) during development. Each point represents mean ± SEM. *P < 0.05, **P < 0.01, significant changes in densities during the whole of development assessed by ANOVA with Bonferroni correction. Fisher's PLSD post hoc tests revealed significant differences between the individual time points, but, for the sake of clarity, the figure shows only the differences between 15-day-old birds and adults as $$P < 0.01 and $$$P < 0.001 and differences between two adjacent time points (marked above the later one) as #P < 0.05, ##P < 0.01, ###P < 0.001.
Figure 14
Figure 14
Images of D1A receptor, D2 receptor, and singing-driven egr1 colocalization in LArea X of the striatum. A1–A4: Colocalization of double-labeled D1A and D2 cells. A1, D1A receptor mRNA labeled with silver grains (black) in brightfield view using radioactive in situ hybridization (RISH); A2, D2 receptor mRNA labeled red using fluorescent situ hybridization (FISH); A3, cell nuclei labeled blue with DAPI; A4, merged image of D1A, D2, and DAPI; the D1A receptor signal is inverted and now silver grains are white. White arrows, D1A+/DAPI+ cells; red arrows, D2+/DAPI+ cells; yellow arrows, D1A+/D2+/DAPI+ cells. B1–B4: Colocalization of double-and triple-labeled neurons with D1A, D2, and undirected singing-driven egr1 expression. B1, D1A receptor mRNA in the cytoplasm labeled green using fluorescent in situ hybridization; B2, D2 receptor mRNA in the cytoplasm labeled with silver grains (white) above cell nuclei labeled blue by DAPI using radioactive in situ hybridization (image taken in darkfield view); B3, egr1 protein labeled red in the nucleus using immunocytochemistry; B4, merged image showing overlap of the D1A, D2, and/or egr1. Green arrows, D1A+/egr1+ neuron; yellow arrows, D1A+/D2+/egr1+ neuron. C: The proportion of cells expressing only D1A, only D2, or D1A and D2 receptors. Open bars show the proportion of cells for each receptor type relative to all cells (DAPI+, n = 1,226 across seven birds); hatched bars show the proportions relative to all egr1-labeled neurons after singing (after undirected singing, n = 747 egr1+ cells total or 124.5 ± 29.5 average egr1+ cells per bird, n = 6 birds; or after directed singing, n = 198 egr1+ cells total or 49.5 ± 13.2 average of egr1+ cells per bird, n = 4 birds). *P < 0.05, ANOVA followed by Fisher's PLSD post hoc test. D: Percentages of D1A-and D2-expressing cells comparing radioactive (RISH) and fluorescent (FISH) in situ hybridizations that were alternated for the D1A and D2 receptors. No differences in RISH vs. FISH results were found (P = 0.86 for D1A; P < 0.30 for D2 t-test, n = 6 animals, averaged over several sections). Regardless of probe combination, there is a higher percentage of D1A relative to D2-expressing cells (***P < 0.001, paired t-test between the percentages of D1A and D2 DAPI-labeled cells, single-or double-labeled, within LArea X of each animal). Scale bars = 10 μm.

Similar articles

Cited by

References

    1. Aizman O, Brismar H, Uhlen P, Zettergren E, Levey AI, Forssberg H, Greengard P, Aperia A. Anatomical and physiological evidence for D1 and D2 dopamine receptor colocalization in neostriatal neurons. Nat Neurosci. 2000;3:226–230. - PubMed
    1. Appeltants D, Absil P, Balthazart J, Ball GF. Identification of the origin of catecholaminergic inputs to HVc in canaries by retrograde tract tracing combined with tyrosine hydroxylase immunocytochemistry. J Chem Neuroanat. 2000;18:117–133. - PubMed
    1. Ariano MA, Larson ER, Noblett KL, Sibley DR, Levine MS. Coexpression of striatal dopamine receptor subtypes and excitatory amino acid subunits. Synapse. 1997;26:400–414. - PubMed
    1. Aronov D, Andalman AS, Fee MS. A specialized forebrain circuit for vocal babbling in the juvenile songbird. Science. 2008;320:630–634. - PubMed
    1. Bailey JN, Breidenthal SE, Jorgensen MJ, McCracken JT, Fairbanks LA. The association of DRD4 and novelty seeking is found in a nonhuman primate model. Psychiatr Genet. 2007;17:23–27. - PubMed

Publication types

MeSH terms