. 2010 Mar 15;518(6):785-99.
doi: 10.1002/cne.22242.

Chronic expression of PPAR-delta by oligodendrocyte lineage cells in the injured rat spinal cord

Affiliations

Chronic expression of PPAR-delta by oligodendrocyte lineage cells in the injured rat spinal cord

Akshata Almad et al. J Comp Neurol. .

Abstract

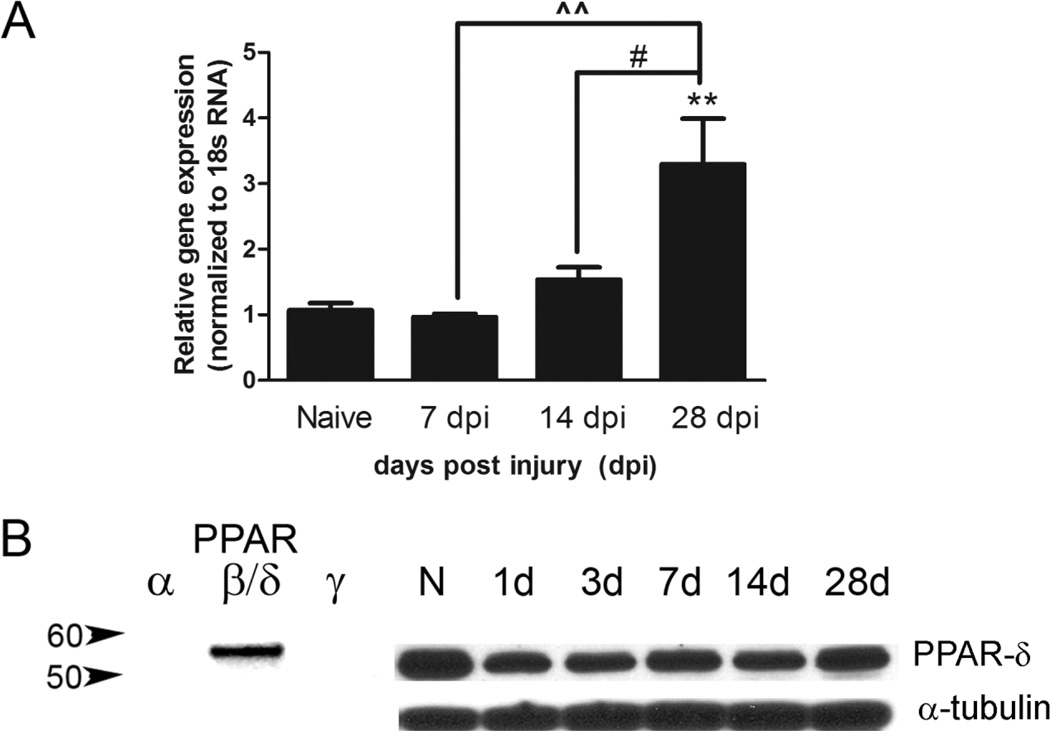
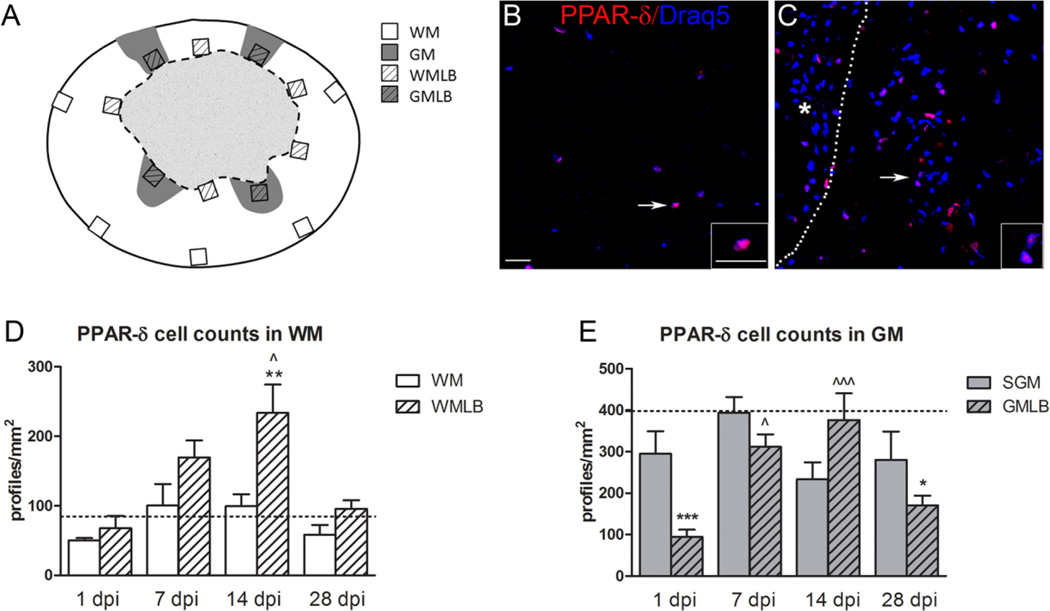
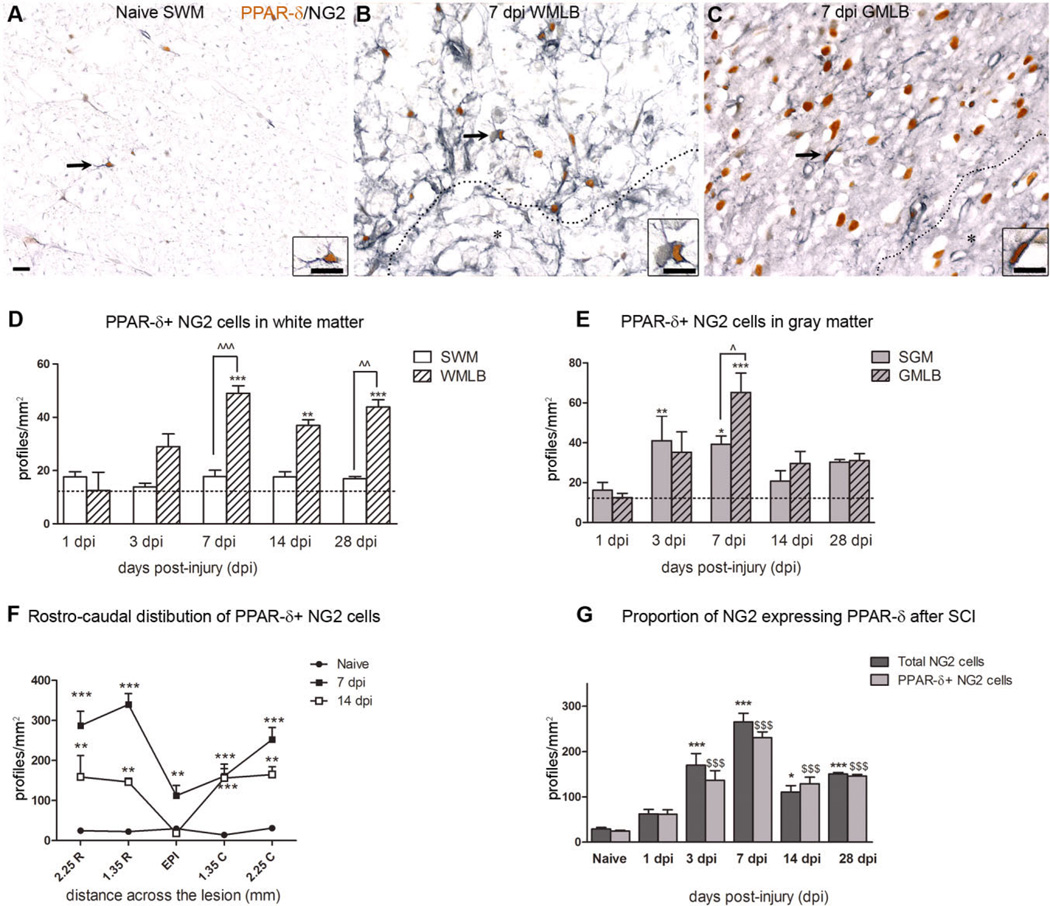
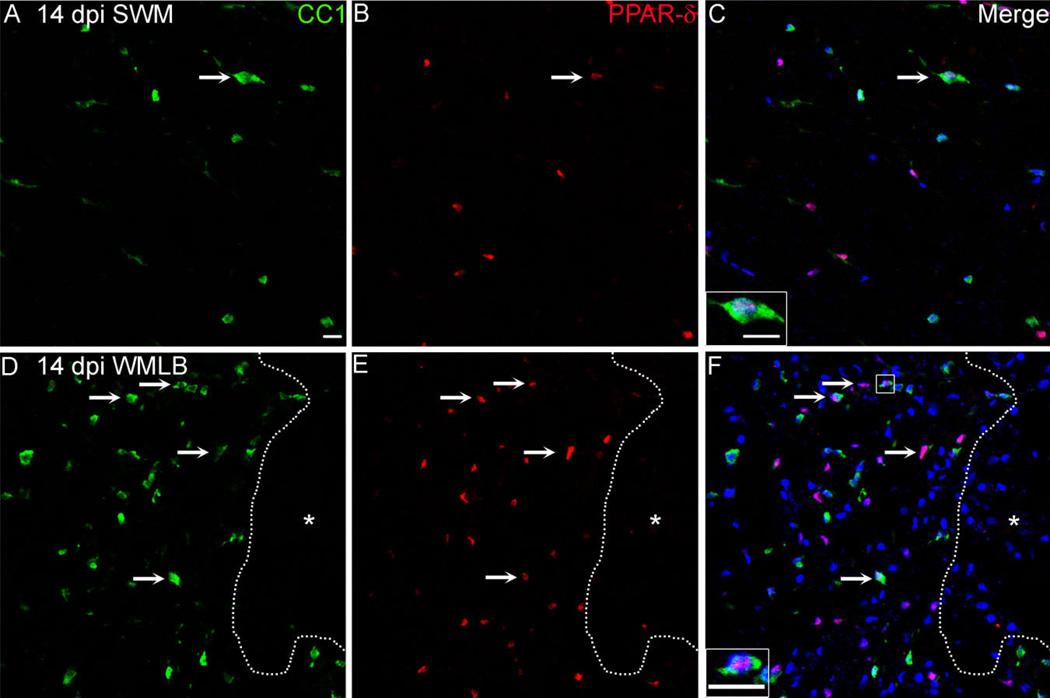
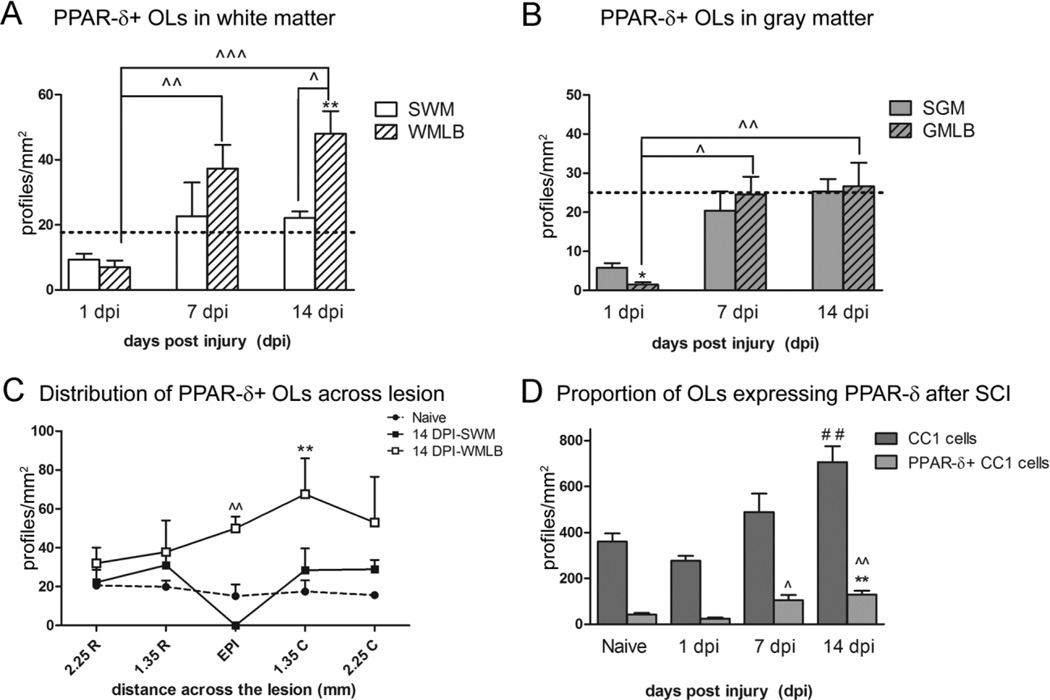
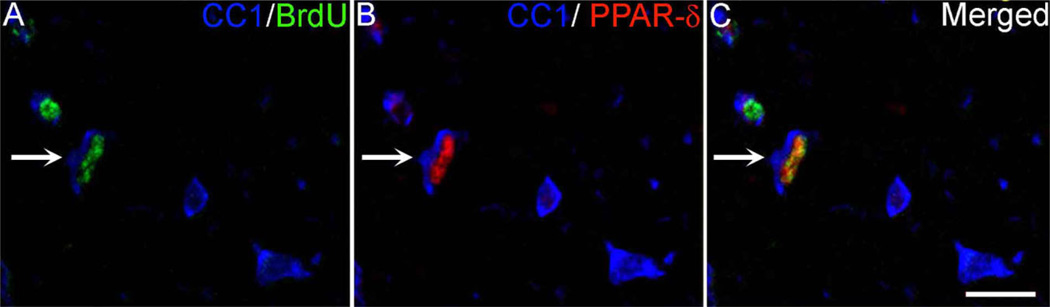
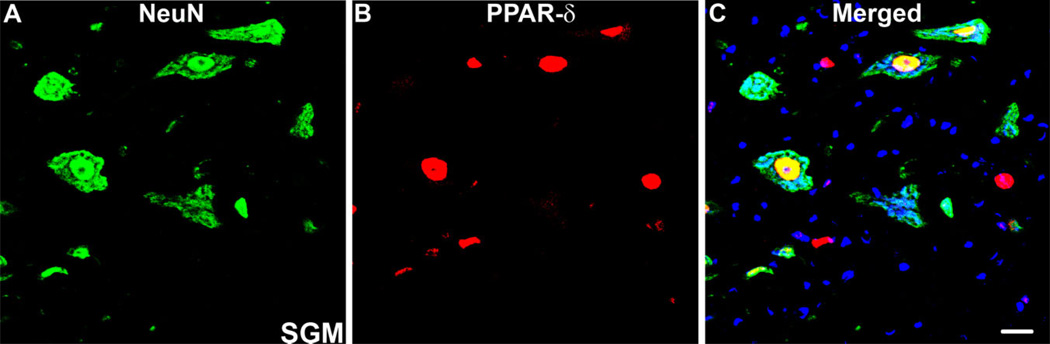
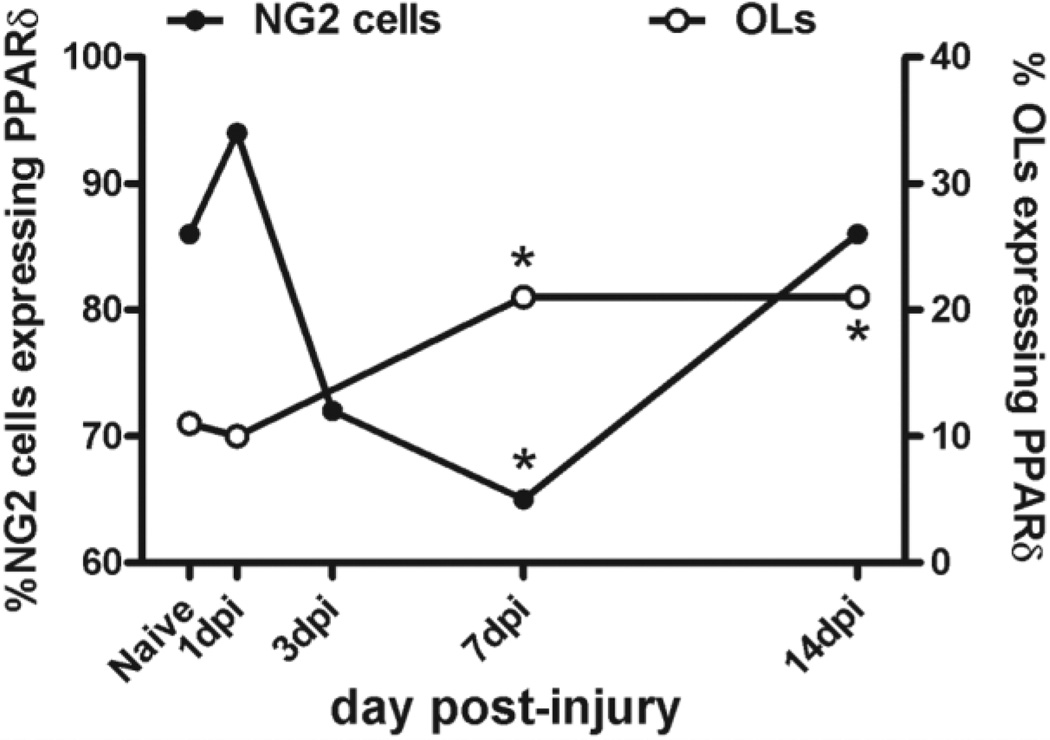
The transcription factor peroxisome proliferator-activated receptor (PPAR)-delta promotes oligodendrocyte differentiation and myelin formation in vitro and is prevalent throughout the brain and spinal cord. Its expression after injury, however, has not been examined. Thus, we used a spinal contusion model to examine the spatiotemporal expression of PPAR-delta in naïve and injured spinal cords from adult rats. As previously reported, PPAR-delta was expressed by neurons and oligodendrocytes in uninjured spinal cords; PPAR-delta was also detected in NG2 cells (potential oligodendrocyte progenitors) within the white matter and gray matter. After spinal cord injury (SCI), PPAR-delta mRNA and protein were present early and increased over time. Overall PPAR-delta+ cell numbers declined at 1 day post injury (dpi), likely reflecting neuron loss, and then rose through 14 dpi. A large proportion of NG2 cells expressed PPAR-delta after SCI, especially along lesion borders. PPAR-delta+ NG2 cell numbers were significantly higher than naive by 7 dpi and remained elevated through at least 28 dpi. PPAR-delta+ oligodendrocyte numbers declined at 1 dpi and then increased over time such that >20% of oligodendrocytes expressed PPAR-delta after SCI compared with approximately 10% in uninjured tissue. The most prominent increase in PPAR-delta+ oligodendrocytes was along lesion borders where at least a portion of newly generated oligodendrocytes (bromodeoxyuridine+) were PPAR-delta+. Consistent with its role in cellular differentiation, the early rise in PPAR-delta+ NG2 cells followed by an increase in new PPAR-delta+ oligodendrocytes suggests that this transcription factor may be involved in the robust oligodendrogenesis detected previously along SCI lesion borders.


Figures

Figure 1
Figure 1
Peroxisome proliferator-activated receptor-δ (PPAR-δ) levels increase chronically after SCI. A: Quantitative real-time PCR for PPAR-δ was performed on homogenates of injured spinal cords at different days post injury (dpi) and normalized to the control gene 18s ribosomal RNA. A significant increase in PPAR-δ mRNA was detected at 28 dpi compared with naïve spinal cords. B: The specificity of the anti-PPAR-δ antibody is demonstrated by the presence of a single specific band for purified recombinant PPAR-δ protein but not for recombinant PPAR-α or γ proteins. The antibody also produced a single band when probed against spinal cord-injured homogenates, with a slight decrease at 1 dpi and subsequent return to naïve levels by 28 dpi. N, naïve; d, day post injury. #, P < 0.05 vs. 14 dpi; ˆˆP < 0.01 vs. 7 dpi; **, P < 0.01 vs. Naive.
Figure 2
Figure 2
Peroxisome proliferator-activated receptor-δ (PPAR-δ)+ cells increase after spinal cord injury (SCI). A: Diagram of an injured spinal cord section demonstrating the sample box placement used to obtain cell counts here and in Figures 3 and 5. WM, white matter; GM, gray matter; WMLB, white matter lesion border; GMLB, gray matter lesion border. B: PPAR-δ+ cell nuclei (red) were present in white matter of naïve spinal cords; sections were counterstained with Draq5 (blue). C: Elevated PPAR-δ+ cell numbers were present along the WMLB at 14 dpi. The dotted line delineates the lesion border (lesion denoted by asterisk). Arrows in B and C point to cells shown at higher magnification in the insets. D: PPAR-δ+ cells in WMLB increased by 7 dpi and were significant higher at 14 dpi compared with naïve WM and outlying spared WM in the same sections, P < 0.05 vs. 14 dpi WM; **, P < 0.01 vs. Naive. E: PPAR-δ cell counts in spared GM and GMLB revealed a decline at 1 dpi, especially along the lesion borders. Cells increased significantly in GMLB at 7 and 14 dpi and then declined again at 28 dpi compared with naïve. SGM, spared gray matter, P < 0.05 vs. 1 dpi GMLB; ˆˆˆ, P < 0.001 vs. 1 dpi GMLB; *, P < 0.05 vs. Naive; ***, P < 0.001 vs. Naive. Dashed lines in D and E represent the number of PPAR-δ+ cells in naïve spinal cord WM and GM. Scale bar = 20 µm in B (applies to B,C) and inset to B (applies to both insets). [Color figure can be viewed in the online issue, which is available at www.interscience.wiley.com.]
Figure 3
Figure 3
PPAR-δ+ NG2 cells are elevated chronically after spinal cord injury (SCI). A: PPAR-δ (orange) and NG2 (black) double-labeled cells were present in white matter of naïve animals. B,C: At 7 dpi, PPAR-δ+ NG2 cells along white matter lesion border (WMLB; B) and gray matter lesion border (GMLB; C) were prominent (lesion border delineated by dashed line; asterisk denotes lesion). Arrows (A–C) indicate cells shown at higher magnification in insets. The 7-dpi images were taken 1.35 mm rostral to epicenter. SWM, spared white matter. D: PPAR-δ+ NG2 cells increased in WMLB at 7, 14, and 28 dpi compared with naïve white matter. Lesion borders also contained more PPAR-δ+ NG2 cells than outlying spared white matter (SWM) along the pial border at 7 and 28 dpi. **, P < 0.01 vs. Naive; ***P < 0.001 vs. Naive; ˆˆ, P <0.01 vs. 28 dpi SWM; ˆˆˆ, P < 0.001 vs. 7 dpi SWM. E: PPAR-δ+ NG2 cells increased compared with naïve in spared gray matter (SGM) at 3 dpi and in SGM and GM lesion borders (GMLB) 7 dpi. GMLB also contained more cells than SGM in the same sections. Dashed lines in D and E represent the number of PPAR-δ+ cells in uninjured tissue. *, P < 0.05 vs. Naive; **, P < 0.01 vs. Naive; ***, P < 0.001 vs. Naive; ˆ, P < 0.05 vs. 7 dpi SGM. F: PPAR-δ+ NG2 cells were elevated compared with naïve tissue in the lesion epicenter at 7 dpi and rostral and caudal to the epicenter at 7 and 14 dpi. **, P < 0.01 vs. Naive; ***, P < 0.001 vs. Naive. G: The total numbers of NG2 cells and PPAR-δ+NG2 cells followed a similar pattern post SCI, with significant increases at 3–28 dpi compared with naïve tissue. *, P < 0.05 vs. Naive Total NG2 cells; ***, P < 0.001 vs. Naive Total NG2 cells; $$$, P < 0.001 vs. Naive PPAR-δ NG2 cells. Scale bar = 10 µm in A (applies to A–C and insets before A–C). [Color figure can be viewed in the online issue, which is available at www.interscience.wiley.com.]
Figure 4
Figure 4
Peroxisome proliferator-activated receptor-δ (PPAR)-δ+ oligodendrocytes (OLs) increase at 14 dpi in white matter lesion borders. A–F: Single channel and merged confocal images of CC1+ OLs (A,D; green) and PPAR-δ (B,E; red) taken from outlying spared white matter (SWM) and WM lesion border (WMLB) in the same cross section at 14 dpi. The number of double-labeled PPAR-δ+ CC1 cells (arrows) increased robustly along lesion borders compared with SWM. Sections were counterstained with Draq5 (blue) and images taken 2.25 mm caudal to epicenter. The dotted line delineates the lesion border and insets show higher magnification PPAR-δ+ CC1 cells. Scale bar= 20 µm in F (applies to A–F) and insets to C,F. [Color figure can be viewed in the online issue, which is available at www.interscience.wiley.com.]
Figure 5
Figure 5
Peroxisome proliferator-activated receptor-δ (PPAR)-δ+ oligodendrocytes (OLs) increase after spinal cord injury (SCI). A: PPAR-δ+ CC1 cells decreased slightly at 1 dpi in white matter (WM). At 7 and 14 dpi, PPAR-δ+ OLs had significantly increased in WM lesion border (WMLB) compared with 1 dpi WMLB. Furthermore, PPAR-δ+ CC1 cells along the WMLB at 14 dpi were significantly greater than naïve WM and spared white matter (SWM) within the same sections. **, P < 0.01 vs. Naive WM; ˆ, P < 0.05 vs. 14 dpi SWM; ˆˆ, P < 0.01 vs. 1 dpi WMLB; ˆˆˆ, P < 0.001 vs. 1 dpi SWM. B: PPAR-δ+ OLs were significantly reduced at 1 dpi in gray matter lesion borders (GMLB) followed by a subsequent rise at 7 and 14 dpi. *, P < 0.05 vs. Naive GM; ˆ, P <, 0.05 vs. 1 dpi GMLB; ˆˆ, P < 0.01 vs. 1 dpi GMLB. C: PPAR-δ+ OL distribution in WM at 14 dpi revealed the highest numbers were present in the WMLB at the epicenter and caudal sections. **, P < 0.01 vs. Naive WM; ˆˆ, P < 0.01 vs. 14 dpi SWM. D: The number of PPAR-δ+ OLs had doubled by 7 dpi compared with naïve. At 14 dpi, the total number of OLs and the number of OLs with PPAR-δ+ nuclei were both significantly increased. **, P < 0.01 vs. Naive PPAR-δ+ CC1 cells; ˆ, P < 0.05 vs. 1 dpi PPAR-δ+ CC1 cells; ˆˆ, P < vs. 1 dpi PPAR-δd+ CC1 cells; ##, P < 0.01 vs. Naive CC1 cells. SGM, spared gray matter.
Figure 6
Figure 6
PPAR-δ is expressed in new oligodendrocytes (OLs) after SCI. A–C: Single-channel and merged confocal images of triple-label immunofluorescence for OLs (CC1; blue), bromodeoxyuridine (BrdU; green), and peroxisome proliferator-activated receptor-δ (PPAR)-δ (red) from a 7-dpi section. The arrow indicates a triple-labeled OL. Scale bar = 20 µm in C (applies to A–C). [Color figure can be viewed in the online issue, which is available at www.interscience.wiley.com.]
Figure 7
Figure 7
PPAR-δ is present in neurons after SCI. A–C: Confocal images of double-labeling for peroxisome proliferator-activated receptor-δ (PPAR)-δ (red) and NeuN (green), a neuronal marker, revealed co-localization in SCI tissue in almost all neurons in spared gray matter (SGM). Image is from 14-dpi tissue, 2.25 mm caudal to epicenter. Scale bar = 20 µm in C (applies to A–C). [Color figure can be viewed in the online issue, which is available at www.interscience.wiley.com.]
Figure 8
Figure 8
Comparison of the percentage of NG2 cells and oligodendrocytes (OLs) expressing peroxisome proliferator-activated receptor-δ (PPAR)-δ over time after SCI. A high percentage of NG2 cells express PPAR-δ in the normal spinal cord (86%). This proportion dropped significantly at 7 dpi compared with naïve and then returned to near normal levels by 14 dpi. In contrast, the ratio of OLs with PPAR-δ+ nuclei was ~11% in uninjured tissue and approximately double at 7 and 14 dpi. *, P < 0.05 vs. naïve.

Similar articles

Cited by

References

    1. Benani A, Heurtaux T, Netter P, Minn A. Activation of peroxisome proliferator-activated receptor alpha in rat spinal cord after peripheral noxious stimulation. Neurosci Lett. 2004;369:59–63. - PubMed
    1. Bhat RV, Axt KJ, Fosnaugh JS, Smith KJ, Johnson KA, Hill DE, Kinzler KW, Baraban JM. Expression of the APC tumor supressor protein in oligodendroglia. Glia. 1996;17:169–174. - PubMed
    1. Braissant O, Wahli W. Differential expression of peroxisome proliferator-activated receptor-alpha,-beta, and -gamma during rat embryonic development. Endocrinology. 1998;139:2748–2754. - PubMed
    1. Coggeshall RE, Lekan HA. Methods for determining numbers of cells and synapses: a cse for more uniform standards of review. J Comp Neurol. 1996;364:6–15. - PubMed
    1. Crowe MJ, Bresnahan JC, Shuman SL, Masters JN, Beattie MS. Apoptosis and delayed degeneration after spinal cord injury in rats and monkeys [published erratum appears in Nat Med 1997;3:240] Nat Med. 1997;3:73–76. - PubMed

Publication types