. 2010 Mar 15;518(6):815-38.
doi: 10.1002/cne.22244.

Localization of a GABA transporter to glial cells in the developing and adult olfactory pathway of the moth Manduca sexta

Affiliations

Localization of a GABA transporter to glial cells in the developing and adult olfactory pathway of the moth Manduca sexta

Lynne A Oland et al. J Comp Neurol. .

Abstract

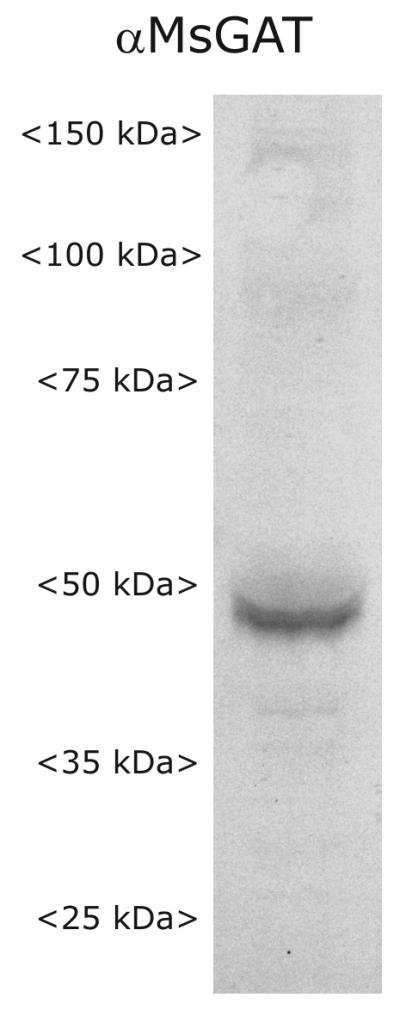
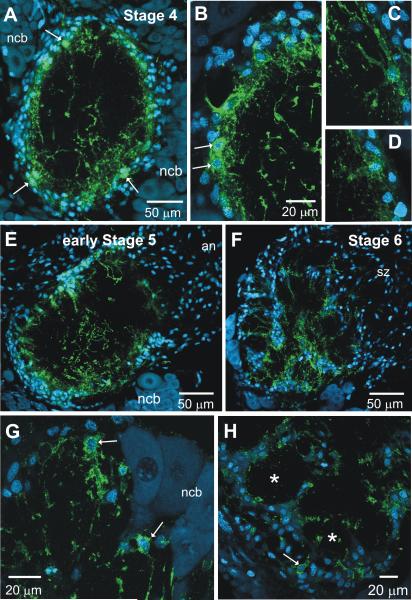
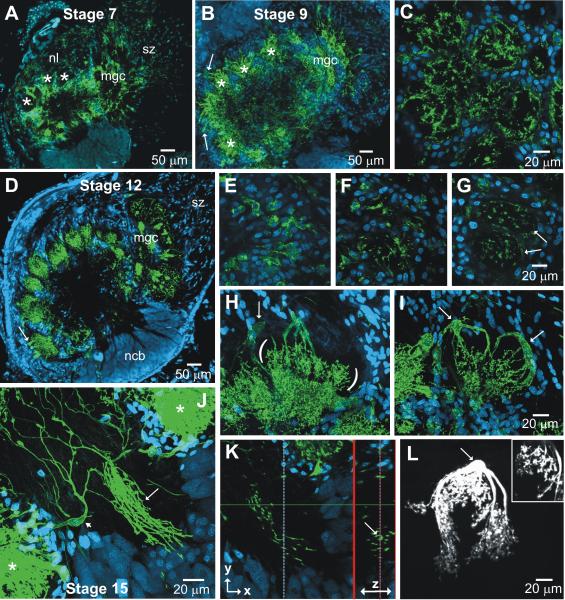
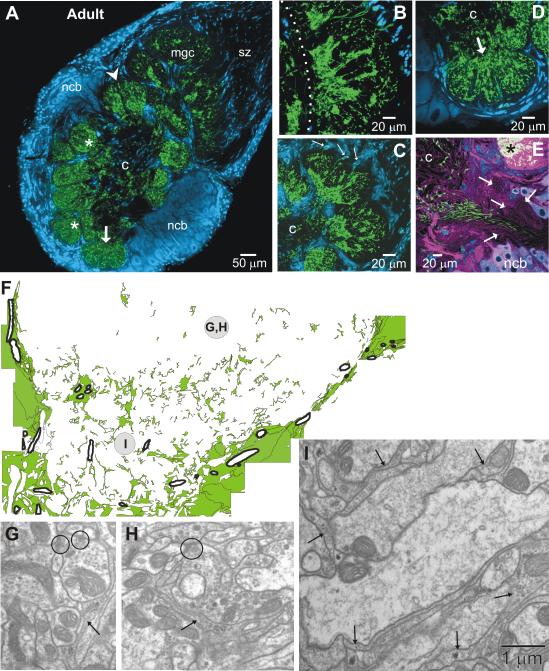
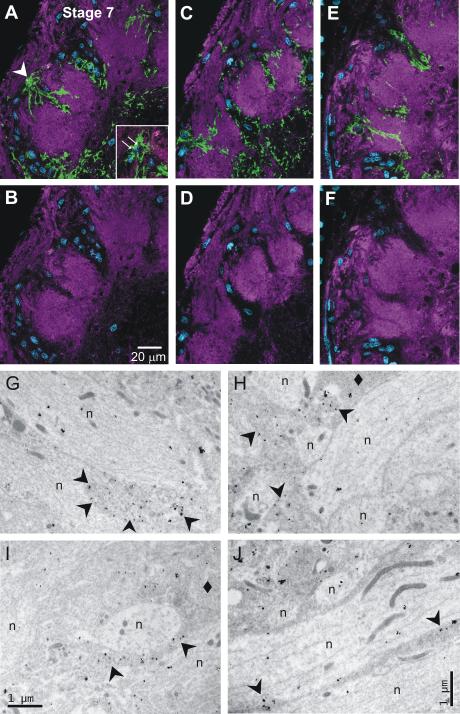
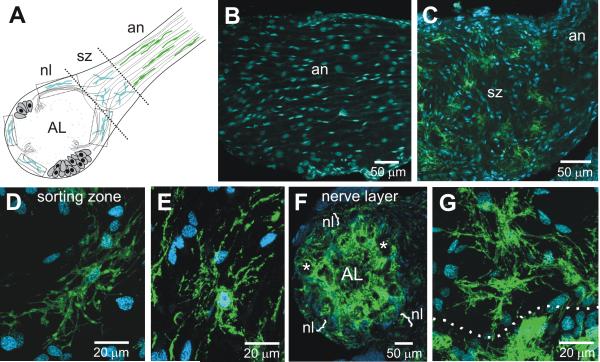
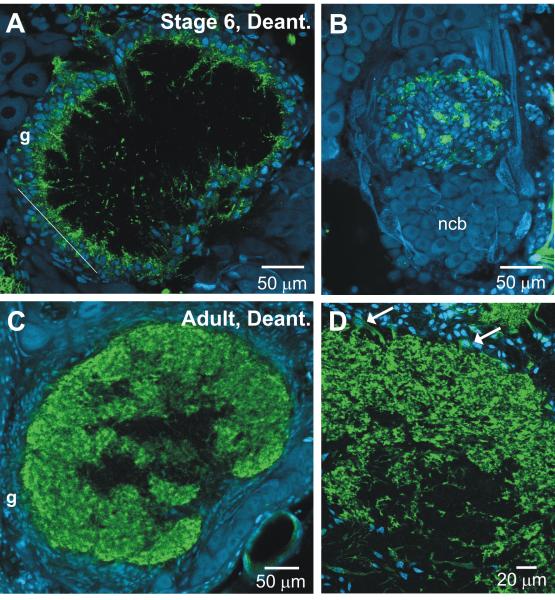
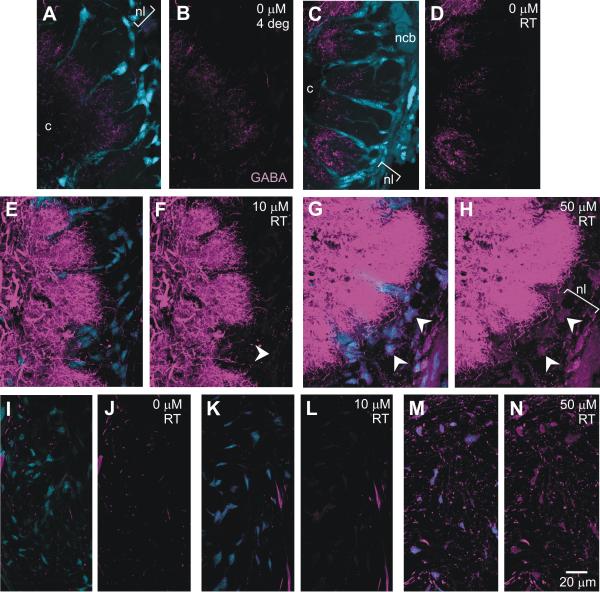
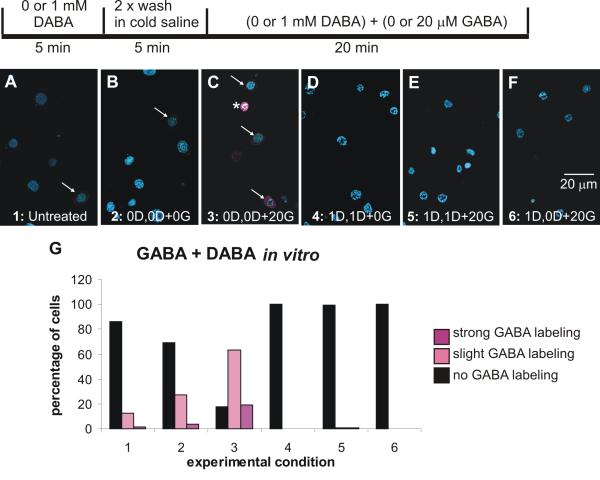
Glial cells have several critical roles in the developing and adult olfactory (antennal) lobe of the moth Manduca sexta. Early in development, glial cells occupy discrete regions of the developing olfactory pathway and processes of gamma-aminobutyric acid (GABA)ergic neurons extend into some of these regions. Because GABA is known to have developmental effects in a variety of systems, we explored the possibility that the glial cells express a GABA transporter that could regulate GABA levels to which olfactory neurons and glial cells are exposed. By using an antibody raised against a characterized high-affinity M. sexta GABA transporter with high sequence homology to known mammalian GABA transporters (Mbungu et al. [1995] Arch. Biochem. Biophys. 318:489-497; Umesh and Gill [2002] J. Comp. Neurol. 448:388-398), we found that the GABA transporter is localized to subsets of centrally derived glial cells during metamorphic adult development. The transporter persists into adulthood in a subset of the neuropil-associated glial cells, but its distribution pattern as determined by light-and electron-microscopic-level immunocytochemistry indicates that it could not serve to regulate GABA concentration in the synaptic cleft. Instead, its role is more likely to regulate extracellular GABA levels within the glomerular neuropil. Expression in the sorting zone glial cells disappears after the period of olfactory receptor axon ingrowth, but may be important during ingrowth if GABA regulates axon growth. Glial cells take up GABA, and that uptake can be blocked by L-2,4-diaminobutyric acid (DABA). This is the first molecular evidence that the central glial cell population in this pathway is heterogeneous.


Figures

Figure 1
Figure 1
Western blot probed with anti-MasGAT antibody showing single strong band at ~48 kD.
Figure 2
Figure 2
Cellular elements of a glomerulus. A. Schematic diagram of the proximal part of the antennal nerve (AN), which carries receptor axons extending from cell bodies in the sensory epithelium of the antenna, and the antennal lobe (AL). SZ: Sorting Zone; nl: nerve layer; gll: glomerular layer. Neuronal cell bodies (ncb) lie almost entirely in 2 large clusters outside of the neuropil and the nerve layer; a third cluster of ~15 cells (not shown) lies on the anterior surface of the AL. The red neuron is a typical uni-glomerular projection neuron; the blue neuron is a typical multi-glomerular local interneuron. Orange processes are olfactory receptor axons and small ovals are central glial cells. Filled small ovals are peripheral glial cells. Asterisk indicates a glomerulus, a cross-section of which is shown schematically below. Glial envelope and representative glial processes in the neuropil are shown in green. Red dotted circle in diagram and in adjacent images B-E: approximate glomerular boundary. B. Some of the 75-100 simple glial cells that form an almost complete envelope around each glomerulus. C. Terminal branches of some of the sensory neurons (~5000/glomerulus) that enter the apical portion of the glomerulus from the nerve layer. D. Dendrites of some of the AL neurons, which enter from the base of the glomerulus (~ 300/glomerulus). E. One of the complex glial cells (<10/glomerulus). Confocal images were prepared using methods routine in the lab: simple glial cells: propidium iodide with RNAse (Oland et al., 1999); receptor neurons: DiI (Oland et al., 1998); AL neuron dendrites: anti-GABA immunocytochemistry (protocol as in Methods); complex glial cell: Lucifer yellow dye fill (Oland et al., 1999). The complex glial cell here and in Figure 6L is a slightly different 3-dimensional reconstruction of the cell shown in Oland et al., 1999. Used with permission from Elsevier.
Figure 3
Figure 3
GABA-positive axons and dendrites in the developing antennal nerve and antennal lobe. A. At stage 4, as the first olfactory receptor (ORN) axons enter the nerve layer, GABA-positive dendrites (magenta) fill the antennal lobe (AL) neuropil and a few dendrites (arrowheads) reach into the glial cell layer (blue, g) that surrounds the neuropil. B. By stage 7, ORN axon terminal branches (not labeled in this figure) have filled the outer portion of each glomerulus (*) and GABA-positive dendrites are still mainly in the basal portion (bracket), as well as in the coarse neuropil (c) in the center. C. Arrows indicate borders of the primary neurite tract within which several subtracts carry GABA-positive processes into the neuropil from the lateral cluster of neuronal cell bodies. D-E. As early as late stage 5, the sorting zone (SZ) portion of the antennal nerve and the nerve layer of the AL include a few GABA-positive fibers. GABA-positive fibers in some cases may be dendrites extending from the glomeruli (arrow in D) but also may be axons that by stage 7 appear in bundles in the antennal nerve and sorting zone. an: antennal nerve; ncb: neuronal cell bodies; nl: nerve layer; pnt: primary neurite tract. In this and all subsequent images, the nucleic acid stain Syto 13 were used to label cell nuclei, which appear in blue.
Figure 4
Figure 4
MasGAT distribution prior to ORN axon ingrowth to the antennal lobe. A. The 5th-larval instar AL neuropil contains numerous MasGAT-positive processes, some of which are tracheolar (t). B. Double-label with anti-MasGAT (green) and anti-HRP (magenta) antibodies, in a single optical section. C-D. Higher power views of the boxed area in B with the channels separated Right and left arrowheads show possible overlap while lower arrowhead indicates a process in which there is no overlap. E-G. By stage 2 of adult metamorphic development, MasGAT labeling in the neuropil is greatly decreased and mostly within the core of the neuropil. Both thick (arrows in F) and thin (arrowhead in F) tracheolar processes still are MasGAT-positive. G shows a rare MasGAT-positive cell body in the glial layer (g) of the neuropil. H-J. Portion of a stage-2 neuropil double-labeled with anti-HRP and anti-MasGAT antibodies. At this stage, fewer MasGAT-positive processes appear to co-localize with HRP, and some partially ensheathe HRP-positive processes. Arrowheads indicate MasGAT-positive processes in the combined and separate channels.
Figure 5
Figure 5
MasGAT distribution during adult metamorphic development of the antennal lobe. A-D. At stage 4, when ORN axon ingrowth has just begun, a few, blebby MasGAT-positive processes are found in the middle of the neuropil. A layer of fine processes extends into the neuropil from a subset of the glial cells (arrows) that forms a shell around the neuropil. C-D shows the morphologies of individual, labeled glial cells at stage 4. During stage 5, MasGAT-positive processes begin to extend into the neuropil (E) and appear in newly developing glomeruli by stage 6 (F) G. Higher power view at stage 6 shows individual MasGAT-positive glial cells (arrows) that are clearly distinct in size and position from the neuronal cell bodies (ncb). Neuronal nuclei usually fail to label with the Syto dyes in M. sexta at these stages, for unknown reasons. H. MasGAT-positive processes begin to line the glial borders forming around each glomeruli. Only a few glial cells are MasGAT-positive.
Figure 6
Figure 6
MasGAT distribution during adult metamporphic development of the antennal lobe (continued). A,B, D. During stages 7, 9, and 12, MasGAT is most strongly associated with the bases of the glomeruli and with the glial borders around each glomerulus (*). Cell bodies of individual glial cells (arrows) are most often associated with the apical (outer) edge of the glomeruli. mgc: male-specific macroglomerular complex. C. Stage 9, Tangential section through the glomerular layer at approximately the midpoint (apex to base) of the glomeruli shows MasGAT-positive processes forming an incomplete lining of the glial border around each glomerulus as well as a small number of processes in the glomerular cores. E-G. Three individual sections from a series taken from the nerve layer into the centers of 2 adjacent glomeruli (arrows). H-I. Large MasGAT-positive cells show large cell bodies (arrows) in the glial border, stout arms and fine branches in the bottom portion of the glomeruli. Parentheses in H flank the highly branched processes in the basal part of the glomerulus. Glial cell in L was filled with Lucifer Yellow during a whole cell recording and belongs to the “complex” glial cell class. Inset shows details of fine branches. J. MasGAT-positive processes in the primary neurite tract of the lateral neuronal cell body cluster (arrow). Small arrow in J indicates a large MasGAT-positive glial cell contributing to the processes in the tract. *, Glomeruli adjacent to the tract. Were the primary neurites of the neurons extending in the track visible (see Fig. 7E), they would be seen traveling in parallel with the MasGAT-labeled processes. K. A smaller stack of 20 optical sections (z=0.4) taken from the stack in J (38 sections). The view to the right of the bold vertical line was generated in the z axis of the optical stack at the position of the thin dotted vertical line on the left of the panel. It shows an image of the tract perpendicular to its long axis (arrow) and shows that the MasGAT-positive processes run in parallel with the (unlabeled) primary neurites, but do not ensheathe them; only one labeled processes has a ‘c’ shape, and none has the circular sheath that would be expected if the process enwrapped an axon(s)
Figure 7
Figure 7
MasGAT in the adult antennal lobe. A. MasGAT persists in the adult, typically most densely expressed in the basal region of each glomerulus (*), though the distribution within glomeruli varies somewhat. Labeled processes also appear in the coarse neuropil (c) in the center of the lobe. No glial cells in the SZ express MasGAT in the adult. Expression is strong in the basal regions of each compartment of the male-specific macroglomerular complex (mgc), shown at higher power in (B) and in the pair of large female glomeruli (C). The cumulus portion of the mgc is to the right of the dotted line. D. Expression in the labial pit organ glomerulus (arrow in A and D) is more diffuse. Cell body labeling is less intense, but when present can be traced to labeled processes in the neuropil (arrows in C). E. Primary neurite tract of the lateral cluster of neuronal cell bodies, double-labeled with anti-MasGAT (green) and anti-HRP (magenta), shows MasGAT-positive processes in a limited region of the tract. Several sub-tracts (arrows) show no MasGAT-positive processes. F. Glial processes (green) traced from an EM montage of a complete cross-section of an ordinary glomerulus with a glial process distribution like that in the glomerulus in A indicated by the arrowhead. The basal half of the glomerulus is shown. Tracheolar processes are outlined with thick black line. The glial envelope that surrounds the glomerulus consists of multiple fine glial processes that were not individually traced, but rather were combined and represented as large regions. The upper region of the tracing (near the center of the glomerulus) has few glial processes. Synapses (circles) in this region (G-H) or in the basal region (I) have no necessary relationship to glial processes (arrows in G-I). In the basal region (I), large dendritic processes are typically partially or fully ensheathed by glial processes.
Figure 8
Figure 8
Identity of MasGAT-positive processes. A-B, C-D, E-F. Glial nuclei in blue. Upper panels (A,C,E) show a portion of stage-7 ALs double-labeled single optical sections with anti-MasGAT (green) and anti-HRP (magenta); lower panels (B,D,F) show only anti-HRP labeling. Comparison of upper and lower panels reveals no overlap between MasGAT-positive and HRP-positive processes, except possibly at the distal tips of the MasGAT-positive processes. These processes are extremely thin so that glial and neuronal processes can occupy the same Z volume. Inset: The labeled processes in A were traced to the cell body that appeared in the position in the glial border indicated by the arrowhead but that was obscured by overlying labeled processes in the full 3-D reconstruction. G-J. Electron micrographs taken in glomerular neuropil with MasGAT indicated by the presence of silver-enhanced gold particles. Some (arrowheads), but not all (diamonds), glial processes contain gold particles. Neuronal processes (n) have no labeling above background.
Figure 9
Figure 9
MasGAT in the developing nerve and nerve layer of the antennal lobe from a stage-7 animal. A. Schematic diagram of the M. sexta nerve and antennal lobe. Peripheral glial cells populate most of the length of the antennal nerve (an), migrating from the antennal sensory epithelium. Centrally derived glial cells populate the sorting zone region (sz), the nerve layer (nl), and form the glomerular borders. B. No MasGAT-positive glial cells were found among the peripheral glial cells. A subset of glial cells in the SZ (C-E) and in the nerve layer (F-G) were MasGAT-positive during the period of ORN axon ingrowth. D-E and G show higher power views of the morphology of individual MasGAT-positive glial cells. Dotted line in G indicates the border between the nerve layer, above, and the apical edge of a glomerulus, below. *, glomerulus.
Figure 10
Figure 10
MasGAT in antennal lobes that developed in the chronic absence of ORN input. A. Glial cells have failed to migrate into the neuropil, but MasGAT-positive glial processes do extend into the neuropil from a subset of the glial cells in the glial border (g). MasGAT-positive process outgrowth is similar to that in a normal lobe at about stage 5-6 of development. B. A tangential section through the glial border of another preparation in roughly the position indicated by the line in A. As in normally developing ALs, only a subset of the glial cells are MasGAT-positive. C, D. Adult. Although lacking glomerular structure, the distribution and amount of MasGAT labeling in the fine-textured neuropil that forms the outer layer of the deafferented AL is about the same as in a normally developing AL. Arrows in D show MasGAT-positive glial cell bodies. ncb: neuronal cell bodies.
Figure 11
Figure 11
Incubation in GABA. First panel of each pair shows GABA (magenta) and glial (blue) labeling; second panel shows only GABA labeling. A-D Glial cells in the nerve layer (nl) and in the glomerular borders showed no GABA labeling under resting conditions (0 uM at 4°C or at RT). E-F. After 20-min incubation in 10 μM GABA, a few glial cells in the AL show faint labeling (arrowhead) and neuronal labeling intensity is increased. G-H. In 50 μM GABA, most glial cells show GABA uptake (arrowheads) and neuronal labeling intensity was greatly increased. The same pattern was found in the SZ region of the nerve (I-N). M-N shows GABA-positive axons, mostly in cross-section, in the SZ. Image collection parameters and 3-D stack sizes were kept constant.
Figure 12
Figure 12
GABA uptake and blockade of uptake by DABA in cultured sorting zone and neuropil glial cells. A-F. Confocal images of cultured glial cells after exposure to GABA and DABA in accord with the experimental protocol shown schematically above. G. Histogram showing that a small percentage of glial cells were GABA-positive (magenta) under control conditions (Conditions 1 and 2). In the presence of 20 mM GABA without DABA (Condition 3), many glial cells became GABA-positive. When DABA was present throughout the experiment, GABA labeling was eliminated, whether or not cells were exposed to 20 μM GABA (Conditions 4 and 5). If DABA was given only for 5-min before GABA treatment (Condition 6), GABA labeling again was eliminated. 982 cells divided among the conditions were examined. D: DABA; G: GABA. Glial cell nuclei labeled with Syto 13 (blue). Lightly GABA-positive cells indicated by arrows; a strongly positive cell by an asterisk.

Similar articles

Cited by

References

    1. Akerman CJ, Cline HT. Refining the roles of GABAergic signaling during neural circuit formation. Trends Neurosci. 2007;30:382–389. - PubMed
    1. Akiba Y, Sasaki H, Huerta PT, Estevez AG, Baker H, Cave JW. gamma-Aminobutyric acid-mediated regulation of the activity-dependent olfactory bulb dopaminergic phenotype. J Neurosci Res. 2009;87:2211–2221. - PMC - PubMed
    1. Barbin G, Pollard H, Gaïarsa JL, Ben-Ari Y. Involvement of GABAA receptors in the outgrowth of cultured hippocampal neurons. Neurosci Lett. 1993;152:150–154. - PubMed
    1. Barker JL, Behar T, Li YX, Liu QY, Ma W, Maric D, Maric I, Schaffner AE, Serafini R, Smith SV, Somogyi R, Vautrin JY, Wen XL, Xian H. GABAergic cells and signals in CNS development. Perspect Dev Neurobiol. 1998;5:305–322. - PubMed
    1. Ben-Ari Y. Excitatory acitons of GABA during development: the nature of the nurture. Nat Rev Neurosci. 2002;3:728–739. - PubMed

Publication types

MeSH terms

Substances