

Cerebral cortex plasticity after 90 days of bed rest: data from TMS and fMRI
- PMID: 20058735
- PMCID: PMC2861654
- DOI: 10.3357/asem.2532.2009
Cerebral cortex plasticity after 90 days of bed rest: data from TMS and fMRI
Abstract
Introduction: Microgravity animal models have demonstrated corticospinal plasticity; however, little is understood of its functional significance. In this pilot study, we explored corticospinal plasticity in a bed rest model. We hypothesized that the lack of weight bearing would induce cortical reorganization correlating with performance.
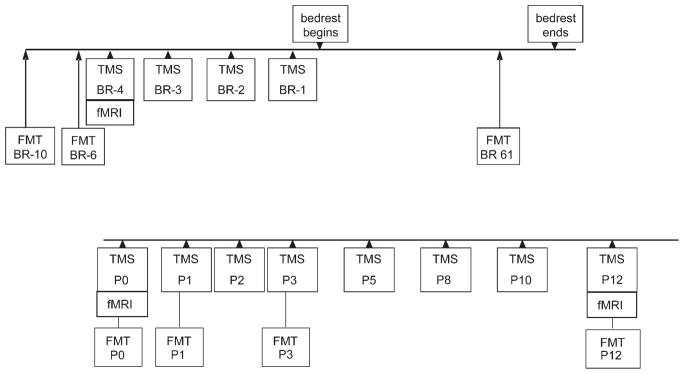
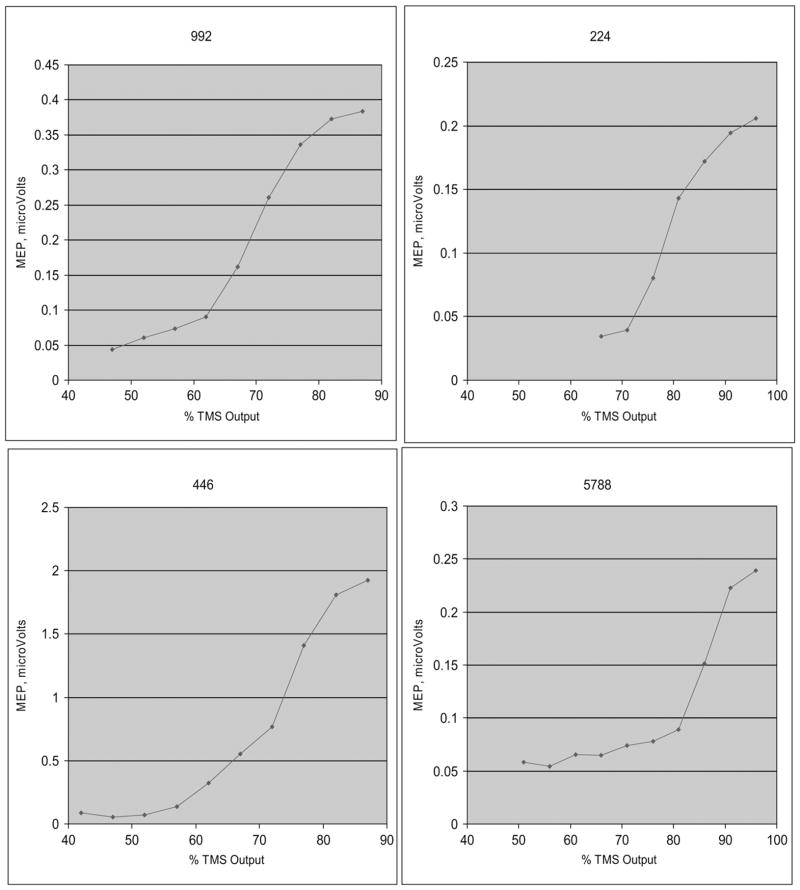
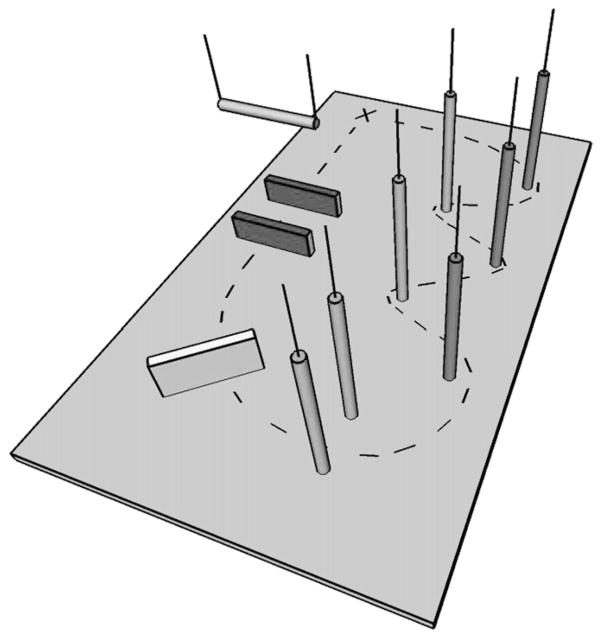
Methods: Four subjects underwent functional MRI (fMRI), transcranial magnetic stimulation (TMS), and functional mobility testing (FMT) before and after 90 d of bed rest. Recruitment curves (RC) were created by measuring motor evoked potentials over a range of TMS intensities with changes in the slope of the RC reflecting changes in corticospinal excitability.
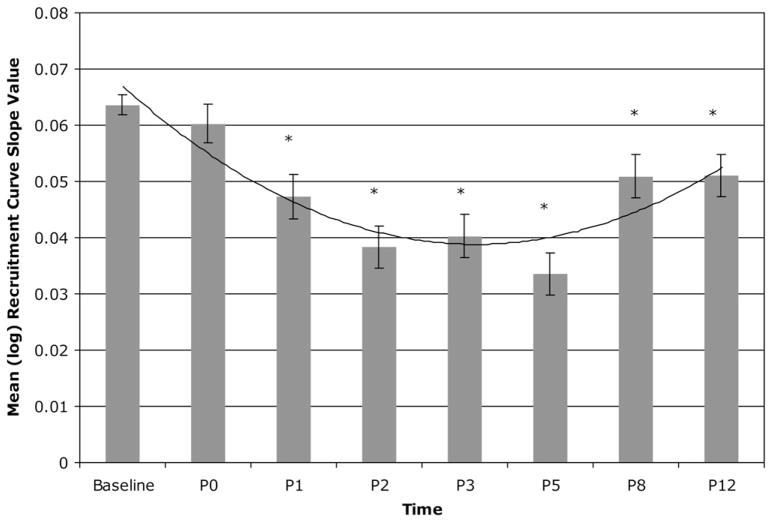
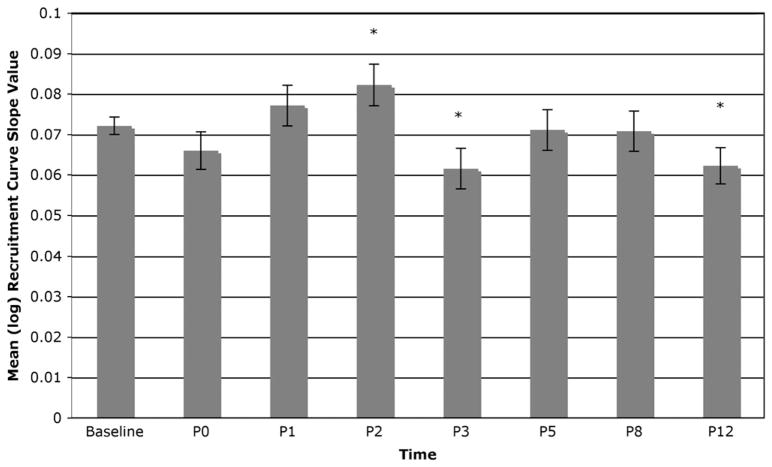
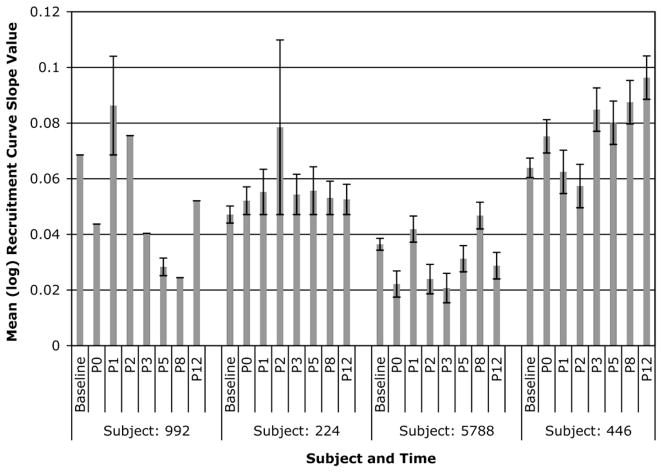
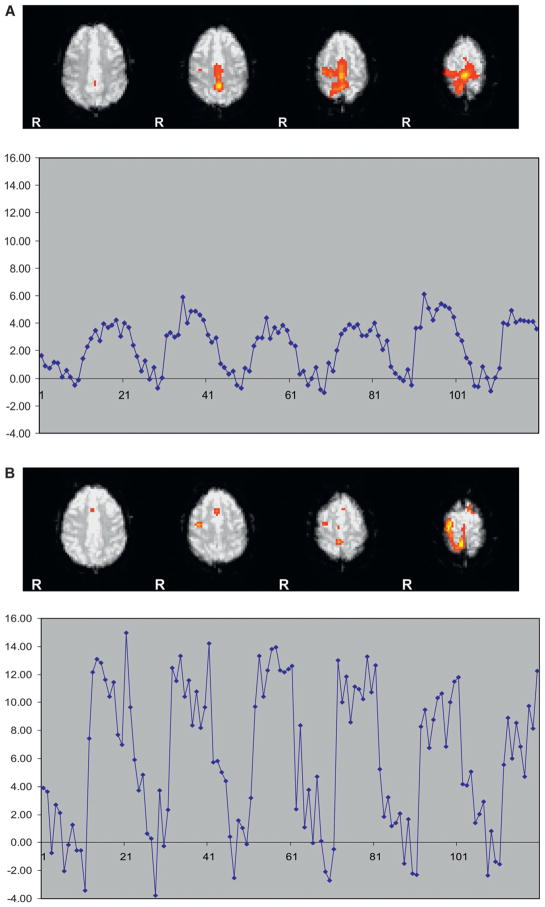
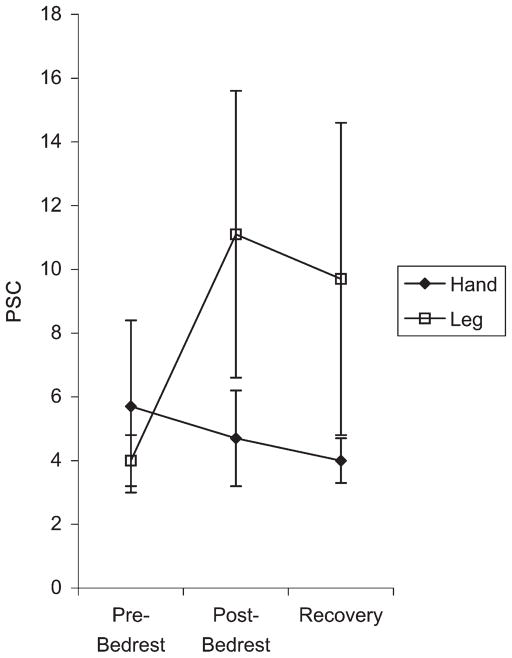
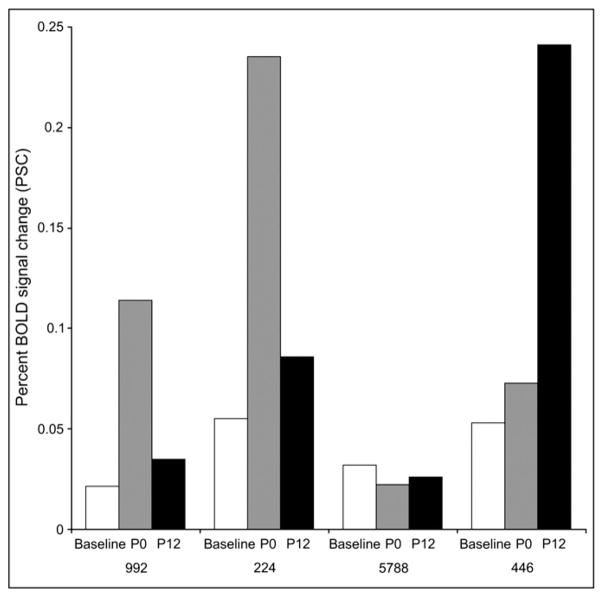
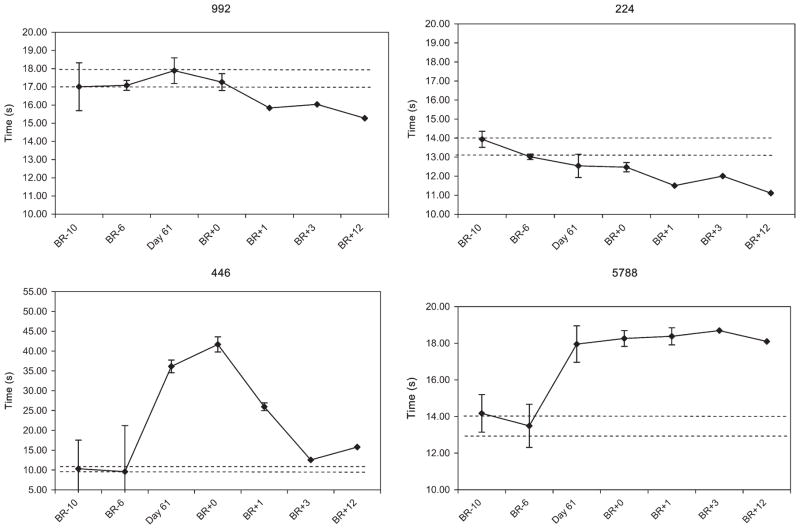
Results: Significant leg RC slope decreases were observed on post-bed rest day 1 (P1) (t(2805) = -4.14, P < 0.0001), P2 (t(2805) = -6.59, P < 0.0001), P3 (t(2805) = -6.15, P < 0.0001), P5 (t(2805) = -7.93, P <0.0001), P8 (t(2805) = -3.30, P = 0.001), and P12 (t(2805)= -3.33, P = 0.0009), suggesting a group decrease in corticospinal excitability in the immediate post-bed rest period with recovery approaching baseline over the following 2 wk. Significant effects were observed for hand RC slopes only for P2 (t(2916) = 1.97, P = 0.049), P3 (t(2916) = -2.12, P = 0.034), and P12 (t(2916) = -2.19, P = 0.029); no significant effects were observed for days P0 (t(2916) = -1.32, ns), P1 (t(2916) = 1.00, ns), P5 (t(2916) = -0.21, ns), or P8 (t(2916) = -0.27, ns). fMRI showed no change in activation for the hand but an increase in activation post-bed rest for the leg. On an individual basis, a more heterogeneous response was found which showed a potential association with performance on FMT.
Discussion: Results of this research include a better understanding of the cortical plasticity associated with leg disuse and may lead to applications in patient and astronaut rehabilitation.
Figures
References
-
- Beck S, Taube W, Gruber M, Amtage F, Gollhofer A, Schubert M. Task-specific changes in motor evoked potentials of lower limb muscles after different training interventions. Brain Res. 2007;1179:51–60. - PubMed
-
- Belichenko PV, Krasnov IB. The dendritic spines of the pyramidal neurons in layer V of the rat sensorimotor cortex following a 14-day space flight. Biull Eksp Biol Med. 1991;112 (11):541–2. - PubMed
-
- Bryk AS, Raudenbush SW. Application of hierarchical linear models to assessing change. Psychol Bull. 1987;101:147–58.
-
- Bryk AS, Raudenbush SW. Hierarchical linear models: Applications and data analysis methods. Newbury Park, CA: Sage Publications; 1992.
-
- Buonomano DV, Merzenich MM. Cortical plasticity: from synapses to maps. Annu Rev Neurosci. 1998;21:149–86. - PubMed
Publication types
MeSH terms
Grants and funding
LinkOut - more resources
Full Text Sources
Medical
Miscellaneous