

Integrated microfluidic device for automated single cell analysis using electrophoretic separation and electrospray ionization mass spectrometry
- PMID: 20058879
- PMCID: PMC2836921
- DOI: 10.1021/ac902218y
Integrated microfluidic device for automated single cell analysis using electrophoretic separation and electrospray ionization mass spectrometry
Abstract
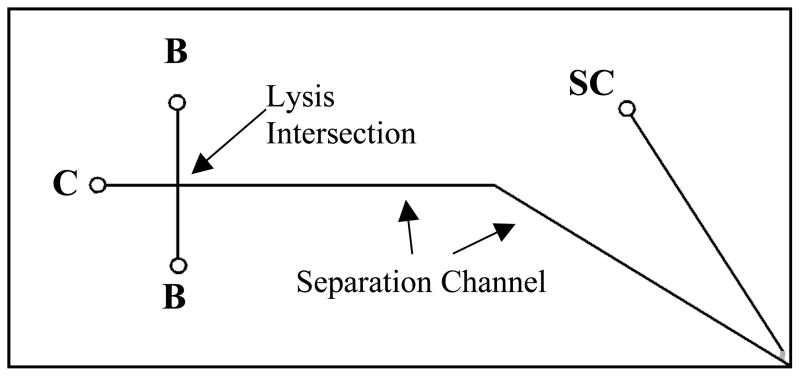
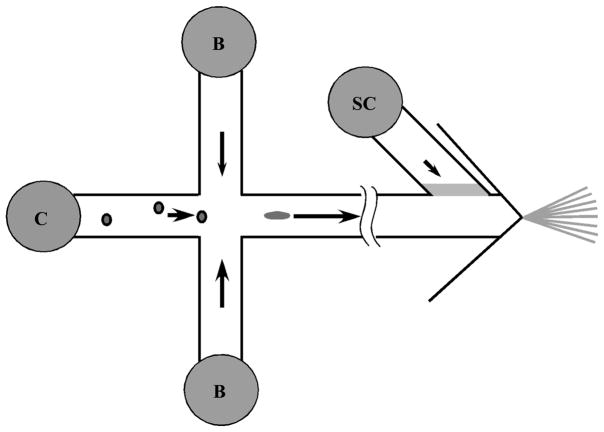
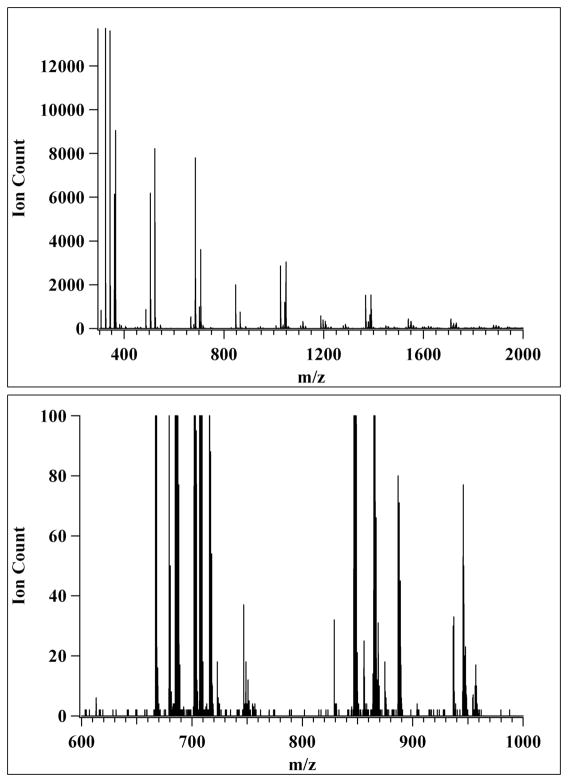
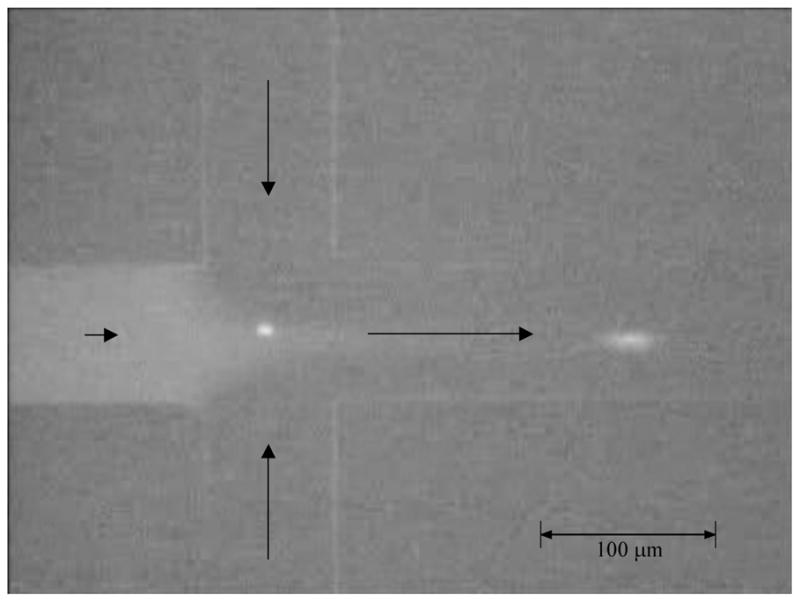
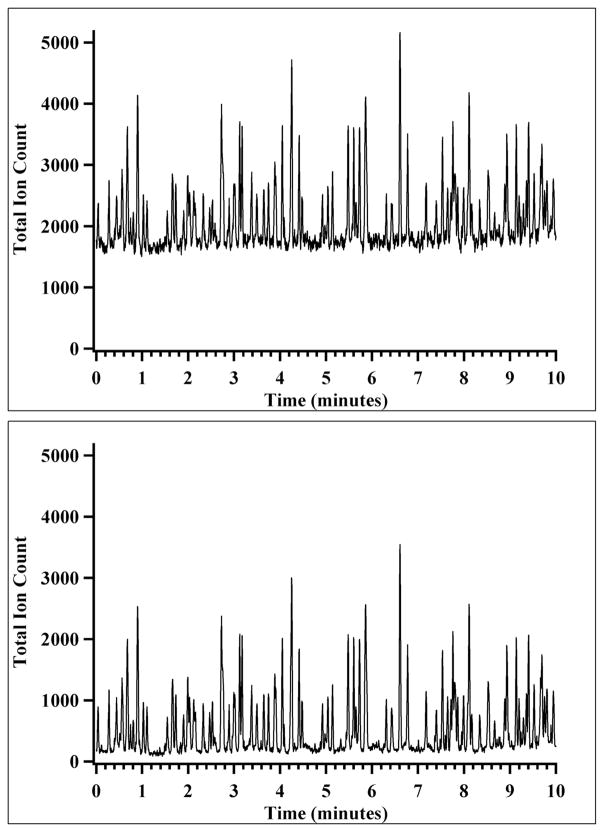
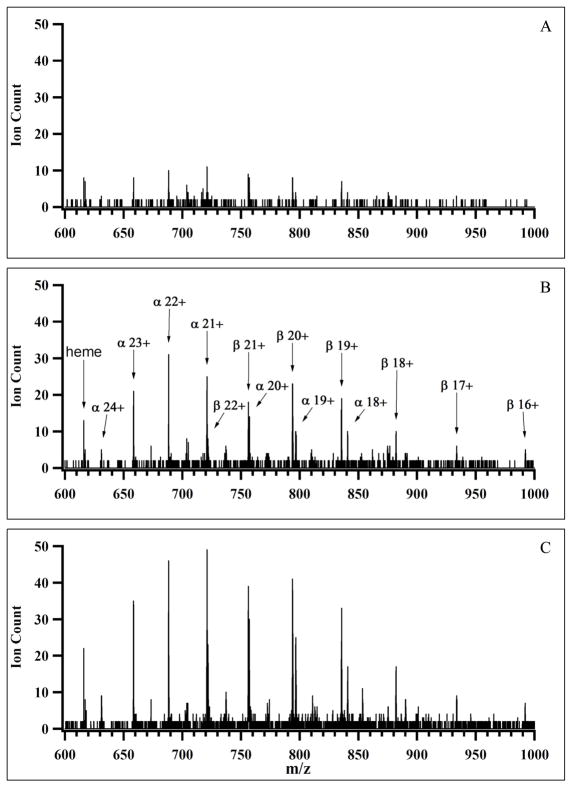
A microfabricated fluidic device was developed for the automated real-time analysis of individual cells using capillary electrophoresis (CE) and electrospray ionization-mass spectrometry (ESI-MS). The microfluidic structure incorporates a means for rapid lysis of single cells within a free solution electrophoresis channel, where cellular constituents were separated, and an integrated electrospray emitter for ionization of separated components. The eluent was characterized using mass spectrometry. Human erythrocytes were used as a model system for this study. In this monolithically integrated device, cell lysis occurs at a channel intersection using a combination of rapid buffer exchange and an increase in electric field strength. An electroosmotic pump is incorporated at the end of the electrophoretic separation channel to direct eluent to the integrated electrospray emitter. The dissociated heme group and the alpha and beta subunits of hemoglobin from individual erythrocytes were detected as cells continuously flowed through the device. The average analysis throughput was approximately 12 cells per minute, demonstrating the potential of this method for high-throughput single cell analysis.
Figures

Similar articles
-
Fully integrated glass microfluidic device for performing high-efficiency capillary electrophoresis and electrospray ionization mass spectrometry.Anal Chem. 2008 Sep 15;80(18):6881-7. doi: 10.1021/ac800428w. Epub 2008 Aug 13. Anal Chem. 2008. PMID: 18698800 Free PMC article.
-
Monolithic integration of two-dimensional liquid chromatography-capillary electrophoresis and electrospray ionization on a microfluidic device.Anal Chem. 2011 Feb 1;83(3):842-9. doi: 10.1021/ac102437z. Epub 2011 Jan 7. Anal Chem. 2011. PMID: 21214194 Free PMC article.
-
Achieving Stable Electrospray Ionization Mass Spectrometry Detection from Microfluidic Chips.Methods Mol Biol. 2019;1906:225-237. doi: 10.1007/978-1-4939-8964-5_15. Methods Mol Biol. 2019. PMID: 30488396 Free PMC article.
-
High-performance liquid chromatographic, capillary electrophoretic and capillary electrophoretic-electrospray ionisation mass spectrometric analysis of selected alkaloid groups.J Chromatogr A. 2002 Aug 16;967(1):85-113. doi: 10.1016/s0021-9673(02)00037-7. J Chromatogr A. 2002. PMID: 12219932 Review.
-
Recent advances in the combination of capillary electrophoresis with mass spectrometry: from element to single-cell analysis.Electrophoresis. 2013 Jan;34(1):70-85. doi: 10.1002/elps.201200488. Epub 2012 Dec 3. Electrophoresis. 2013. PMID: 23161493 Review.
Cited by
-
Single Cell Proteomics Using Frog (Xenopus laevis) Blastomeres Isolated from Early Stage Embryos, Which Form a Geometric Progression in Protein Content.Anal Chem. 2016 Jul 5;88(13):6653-7. doi: 10.1021/acs.analchem.6b01921. Epub 2016 Jun 22. Anal Chem. 2016. PMID: 27314579 Free PMC article.
-
Microfluidic Platform with In-Chip Electrophoresis Coupled to Mass Spectrometry for Monitoring Neurochemical Release from Nerve Cells.Anal Chem. 2016 May 17;88(10):5338-44. doi: 10.1021/acs.analchem.6b00638. Epub 2016 May 4. Anal Chem. 2016. PMID: 27111409 Free PMC article.
-
Design and Application of Sensors for Chemical Cytometry.ACS Chem Biol. 2018 Jul 20;13(7):1741-1751. doi: 10.1021/acschembio.7b01009. Epub 2018 Feb 8. ACS Chem Biol. 2018. PMID: 29376326 Free PMC article. Review.
-
Proteomics for Low Cell Numbers: How to Optimize the Sample Preparation Workflow for Mass Spectrometry Analysis.J Proteome Res. 2021 Sep 3;20(9):4217-4230. doi: 10.1021/acs.jproteome.1c00321. Epub 2021 Jul 30. J Proteome Res. 2021. PMID: 34328739 Free PMC article.
-
Summit: Automated Analysis of Arrayed Single-Cell Gel Electrophoresis.SLAS Technol. 2021 Dec;26(6):637-649. doi: 10.1177/24726303211036869. Epub 2021 Sep 2. SLAS Technol. 2021. PMID: 34474610 Free PMC article.
References
-
- Krylov SN, Arriaga E, Zheru Z, Chan N, Palcic MM, Dovichi NJ. Cytometry. 1999;37:14–20. - PubMed
-
- Swanek FD, Ferris SS, Ewing AG. In: Handbook of Capillary Electrophoresis. 2. Landers JP, editor. CRC Press; Boca Raton, FL: 1997. pp. 495–544.
-
- Turner EH, Cohen D, Pugsley HR, Gomez DG, Whitmore CD, Zhu C, Dovichi NJ. Anal Bioanal Chem. 2008;390:223–226. - PubMed
-
- Price AK, Culbertson CT. Anal Chem A-Pages. 2007;79:2614–2621. - PubMed
-
- Borland LM, Kottegoda S, Phillips KS, Allbritton NL. Annual Review of Analytical Chemistry. 2008;1:191–227. - PubMed
Publication types
MeSH terms
Grants and funding
LinkOut - more resources
Full Text Sources
Other Literature Sources
Molecular Biology Databases
