

Distortion product otoacoustic emission phase and component analysis in human newborns
- PMID: 20058979
- PMCID: PMC2821166
- DOI: 10.1121/1.3268611
Distortion product otoacoustic emission phase and component analysis in human newborns
Abstract
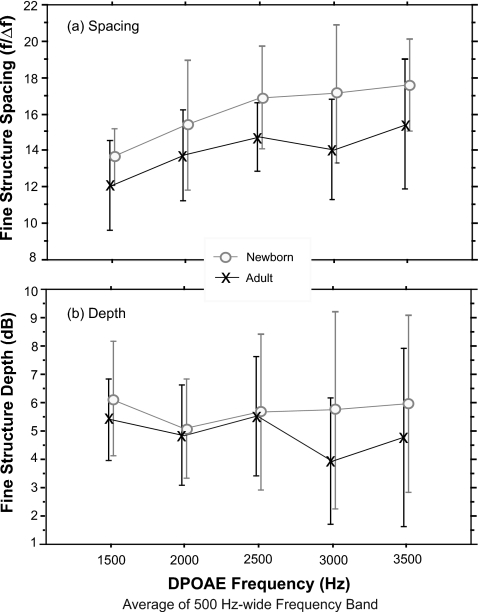
Apical distortion product otoacoustic emissions (DPOAEs) are comprised of at least two components, as evidenced by the interference pattern of alternating maxima and minima known as fine structure. DPOAE fine structure is produced by the shifting phase relationship in the ear canal, between the generator and characteristic frequency (CF) component of the response. Each component arises from a different cochlear region and, according to theory, reflects a distinct generation mechanism. The analysis of DPOAE components and phase in newborns may provide a window into targeted aspects of cochlear physiology during development. 2f(1)-f(2) DPOAE fine structure was recorded from 15 adults and 14 newborns using a swept-tone technique. DPOAE group delay, as well as magnitude and phase of each component, was compared between age groups. Results show narrower fine structure spacing, a longer group delay (steeper phase gradient) in low frequencies, and a stronger relative contribution from the CF component in newborns. The prolonged group delay for low-frequency DPOAEs could indicate immature basilar membrane motion in the apex of the cochlea and warrants further investigation. The enhanced contribution from the CF component may have implications for clinical practice as well as for theories of cochlear maturation.
Figures


Similar articles
-
Breaking away: violation of distortion emission phase-frequency invariance at low frequencies.J Acoust Soc Am. 2011 May;129(5):3115-22. doi: 10.1121/1.3569732. J Acoust Soc Am. 2011. PMID: 21568414 Free PMC article.
-
Level dependence of distortion product otoacoustic emission phase is attributed to component mixing.J Acoust Soc Am. 2011 May;129(5):3123-33. doi: 10.1121/1.3573992. J Acoust Soc Am. 2011. PMID: 21568415 Free PMC article.
-
Maturation and aging of the human cochlea: a view through the DPOAE looking glass.J Assoc Res Otolaryngol. 2012 Jun;13(3):403-21. doi: 10.1007/s10162-012-0319-2. Epub 2012 Apr 3. J Assoc Res Otolaryngol. 2012. PMID: 22476702 Free PMC article.
-
Objective audiometry with DPOAEs : New findings for generation mechanisms and clinical applications.HNO. 2017 Aug;65(Suppl 2):122-129. doi: 10.1007/s00106-016-0267-y. HNO. 2017. PMID: 28470484 Free PMC article. Review.
-
Swept Along: Measuring Otoacoustic Emissions Using Continuously Varying Stimuli.J Assoc Res Otolaryngol. 2024 Apr;25(2):91-102. doi: 10.1007/s10162-024-00934-5. Epub 2024 Feb 26. J Assoc Res Otolaryngol. 2024. PMID: 38409555 Free PMC article. Review.
Cited by
-
Extended low-frequency phase of the distortion-product otoacoustic emission in human newborns.JASA Express Lett. 2021 Jan;1(1):014404. doi: 10.1121/10.0003192. JASA Express Lett. 2021. PMID: 33589887 Free PMC article.
-
The Auditory Nerve Overlapped Waveform (ANOW) Detects Small Endolymphatic Manipulations That May Go Undetected by Conventional Measurements.Front Neurosci. 2017 Jul 18;11:405. doi: 10.3389/fnins.2017.00405. eCollection 2017. Front Neurosci. 2017. PMID: 28769744 Free PMC article.
-
Descriptive Characterization of High-Frequency Distortion Product Otoacoustic Emission Source Components in Children.J Speech Lang Hear Res. 2023 Aug 3;66(8):2950-2966. doi: 10.1044/2023_JSLHR-23-00013. Epub 2023 Jul 19. J Speech Lang Hear Res. 2023. PMID: 37467378 Free PMC article.
-
Characterizing distortion-product otoacoustic emission components across four species.J Acoust Soc Am. 2011 May;129(5):3090-103. doi: 10.1121/1.3560123. J Acoust Soc Am. 2011. PMID: 21568412 Free PMC article.
-
Differences in distortion product otoacoustic emission phase recorded from human neonates using two popular probes.J Acoust Soc Am. 2010 Jul;128(1):EL49-55. doi: 10.1121/1.3453415. J Acoust Soc Am. 2010. PMID: 20649189 Free PMC article.
References
Publication types
MeSH terms
Grants and funding
LinkOut - more resources
Full Text Sources
Miscellaneous