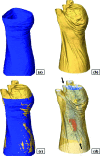
Three-dimensional reconstruction in free-space whole-body fluorescence tomography of mice using optically reconstructed surface and atlas anatomy
- PMID: 20059248
- PMCID: PMC2801728
- DOI: 10.1117/1.3258836
Three-dimensional reconstruction in free-space whole-body fluorescence tomography of mice using optically reconstructed surface and atlas anatomy
Abstract
We present a 3-D image reconstruction method for free-space fluorescence tomography of mice using hybrid anatomical prior information. Specifically, we use an optically reconstructed surface of the experimental animal and a digital mouse atlas to approximate the anatomy of the animal as structural priors to assist image reconstruction. Experiments are carried out on a cadaver of a nude mouse with a fluorescent inclusion (2.4-mm-diam cylinder) implanted in the chest cavity. Tomographic fluorescence images are reconstructed using an iterative algorithm based on a finite element method. Coregistration of the fluorescence reconstruction and micro-CT (computed tomography) data acquired afterward show good localization accuracy (localization error 1.2+/-0.6 mm). Using the optically reconstructed surface, but without the atlas anatomy, image reconstruction fails to show the fluorescent inclusion correctly. The method demonstrates the utility of anatomical priors in support of free-space fluorescence tomography.
Figures


Similar articles
-
A combined fluorescence and microcomputed tomography system for small animal imaging.IEEE Trans Biomed Eng. 2010 Dec;57(12):2876-83. doi: 10.1109/TBME.2010.2073468. Epub 2010 Sep 7. IEEE Trans Biomed Eng. 2010. PMID: 20833597
-
Hybrid system for simultaneous fluorescence and x-ray computed tomography.IEEE Trans Med Imaging. 2010 Feb;29(2):465-73. doi: 10.1109/TMI.2009.2035310. Epub 2009 Nov 10. IEEE Trans Med Imaging. 2010. PMID: 19906585
-
An adaptive regularization parameter choice strategy for multispectral bioluminescence tomography.Med Phys. 2011 Nov;38(11):5933-44. doi: 10.1118/1.3635221. Med Phys. 2011. PMID: 22047358
-
In vivo bioluminescence tomography with a blocking-off finite-difference SP3 method and MRI/CT coregistration.Med Phys. 2010 Jan;37(1):329-38. doi: 10.1118/1.3273034. Med Phys. 2010. PMID: 20175496 Free PMC article.
-
Performance evaluation of a micro-CT system for laboratory animal imaging with iterative reconstruction capabilities.Med Phys. 2022 May;49(5):3121-3133. doi: 10.1002/mp.15538. Epub 2022 Feb 22. Med Phys. 2022. PMID: 35170057
Cited by
-
Super-resolution method for arbitrary retrospective sampling in fluorescence tomography with raster scanning photodetectors.Proc SPIE Int Soc Opt Eng. 2013 Mar 22;8572:10.1117/12.2001518. doi: 10.1117/12.2001518. Proc SPIE Int Soc Opt Eng. 2013. PMID: 24224075 Free PMC article.
-
Highly efficient detection in fluorescence tomography of quantum dots using time-gated acquisition and ultrafast pulsed laser.Proc SPIE Int Soc Opt Eng. 2011 Jan 23;7896:78962W. doi: 10.1117/12.875502. Proc SPIE Int Soc Opt Eng. 2011. PMID: 21373380 Free PMC article.
-
Deep Learning in Biomedical Optics.Lasers Surg Med. 2021 Aug;53(6):748-775. doi: 10.1002/lsm.23414. Epub 2021 May 20. Lasers Surg Med. 2021. PMID: 34015146 Free PMC article. Review.
-
Small-animal 360-deg fluorescence diffuse optical tomography using structural prior information from ultrasound imaging.J Biomed Opt. 2020 Mar;25(3):1-11. doi: 10.1117/1.JBO.25.3.036001. J Biomed Opt. 2020. PMID: 32129028 Free PMC article.
-
A coupled finite element-boundary element method for modeling Diffusion equation in 3D multi-modality optical imaging.Biomed Opt Express. 2010 Sep 1;1(2):398-413. doi: 10.1364/BOE.1.000398. Epub 2010 Aug 2. Biomed Opt Express. 2010. PMID: 21152113 Free PMC article.
References
Publication types
MeSH terms
Grants and funding
LinkOut - more resources
Full Text Sources
Other Literature Sources

