

Analysis of the heat shock response in mouse liver reveals transcriptional dependence on the nuclear receptor peroxisome proliferator-activated receptor alpha (PPARalpha)
- PMID: 20059764
- PMCID: PMC2823686
- DOI: 10.1186/1471-2164-11-16
Analysis of the heat shock response in mouse liver reveals transcriptional dependence on the nuclear receptor peroxisome proliferator-activated receptor alpha (PPARalpha)
Abstract
Background: The nuclear receptor peroxisome proliferator-activated receptor alpha (PPARalpha) regulates responses to chemical or physical stress in part by altering expression of genes involved in proteome maintenance. Many of these genes are also transcriptionally regulated by heat shock (HS) through activation by HS factor-1 (HSF1). We hypothesized that there are interactions on a genetic level between PPARalpha and the HS response mediated by HSF1.
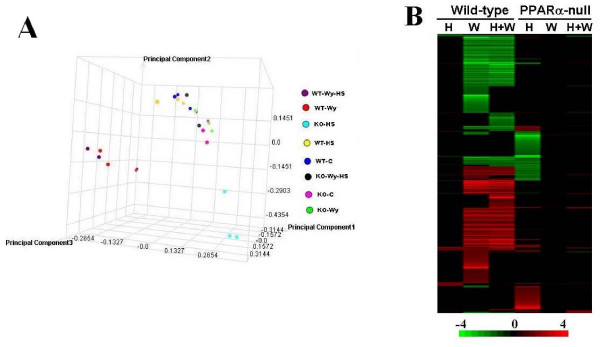
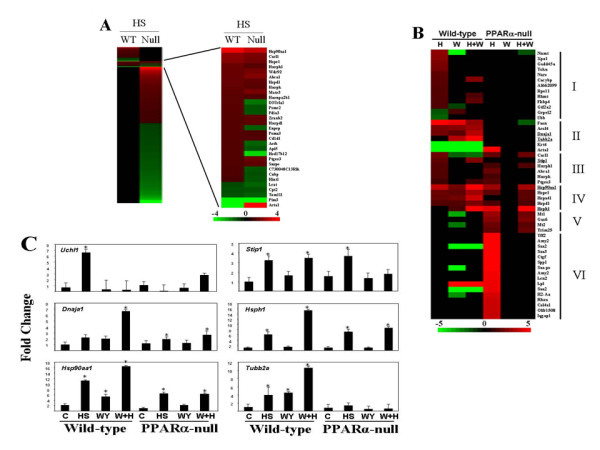
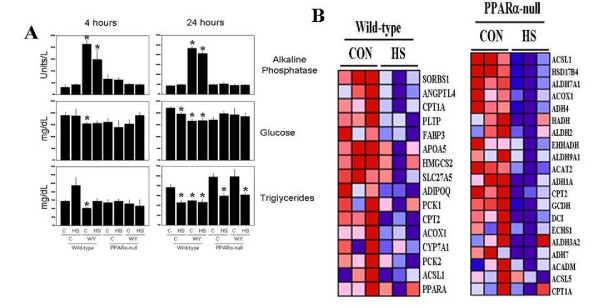
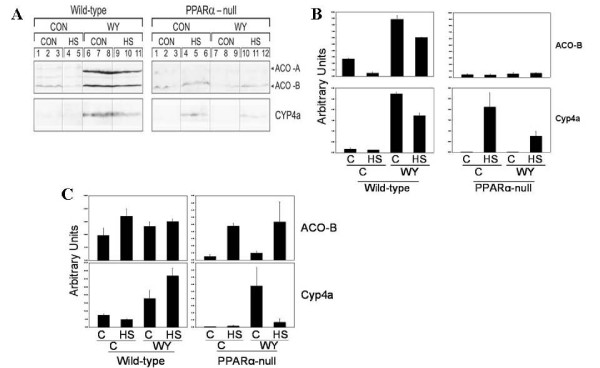
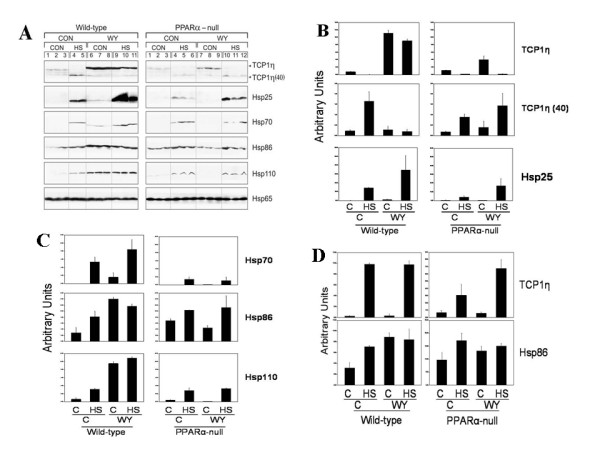
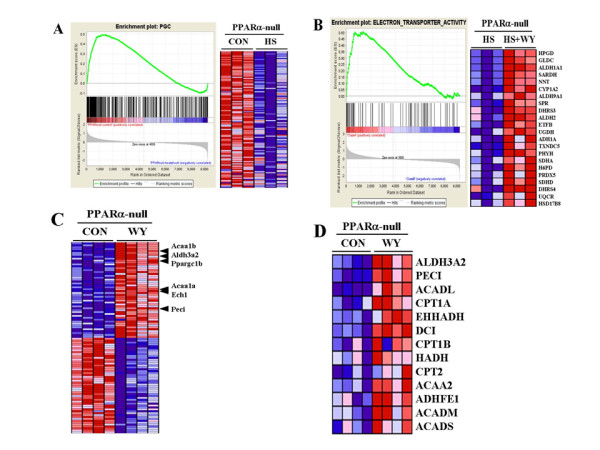
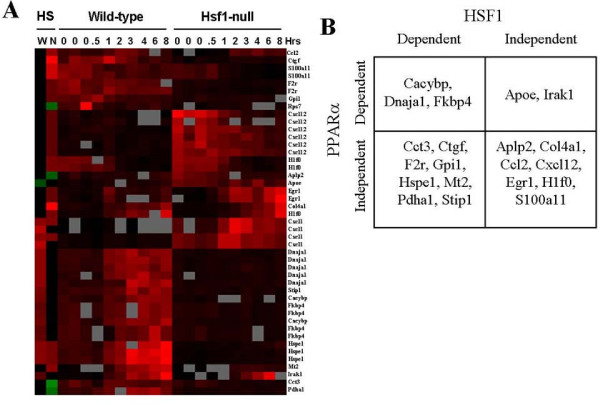
Results: Wild-type and PPARalpha-null mice were exposed to HS, the PPARalpha agonist WY-14,643 (WY), or both; gene and protein expression was examined in the livers of the mice 4 or 24 hrs after HS. Gene expression profiling identified a number of Hsp family members that were altered similarly in both mouse strains. However, most of the targets of HS did not overlap between strains. A subset of genes was shown by microarray and RT-PCR to be regulated by HS in a PPARalpha-dependent manner. HS also down-regulated a large set of mitochondrial genes specifically in PPARalpha-null mice that are known targets of PPARgamma co-activator-1 (PGC-1) family members. Pretreatment of PPARalpha-null mice with WY increased expression of PGC-1beta and target genes and prevented the down-regulation of the mitochondrial genes by HS. A comparison of HS genes regulated in our dataset with those identified in wild-type and HSF1-null mouse embryonic fibroblasts indicated that although many HS genes are regulated independently of both PPARalpha and HSF1, a number require both factors for HS responsiveness.
Conclusions: These findings demonstrate that the PPARalpha genotype has a dramatic effect on the transcriptional targets of HS and support an expanded role for PPARalpha in the regulation of proteome maintenance genes after exposure to diverse forms of environmental stress including HS.
Figures
Similar articles
-
The transcriptional response to a peroxisome proliferator-activated receptor alpha agonist includes increased expression of proteome maintenance genes.J Biol Chem. 2004 Dec 10;279(50):52390-8. doi: 10.1074/jbc.M409347200. Epub 2004 Sep 15. J Biol Chem. 2004. PMID: 15375163
-
Overlapping transcriptional programs regulated by the nuclear receptors peroxisome proliferator-activated receptor alpha, retinoid X receptor, and liver X receptor in mouse liver.Mol Pharmacol. 2004 Dec;66(6):1440-52. doi: 10.1124/mol.104.005496. Epub 2004 Sep 15. Mol Pharmacol. 2004. PMID: 15371561
-
PPARα-independent transcriptional targets of perfluoroalkyl acids revealed by transcript profiling.Toxicology. 2017 Jul 15;387:95-107. doi: 10.1016/j.tox.2017.05.013. Epub 2017 May 27. Toxicology. 2017. PMID: 28558994 Free PMC article.
-
Toxic effects of fumonisin in mouse liver are independent of the peroxisome proliferator-activated receptor alpha.Toxicol Sci. 2006 Jan;89(1):108-19. doi: 10.1093/toxsci/kfj019. Epub 2005 Oct 12. Toxicol Sci. 2006. PMID: 16221962
-
[Regulation of heat shock gene expression in response to stress].Mol Biol (Mosk). 2017 May-Jun;51(3):400-417. doi: 10.7868/S0026898417020100. Mol Biol (Mosk). 2017. PMID: 28707656 Review. Russian.
Cited by
-
Regulation of Proteome Maintenance Gene Expression by Activators of Peroxisome Proliferator-Activated Receptor α.PPAR Res. 2010;2010:727194. doi: 10.1155/2010/727194. Epub 2011 Jan 17. PPAR Res. 2010. PMID: 21318169 Free PMC article.
-
PPARs: Protectors or Opponents of Myocardial Function?PPAR Res. 2015;2015:835985. doi: 10.1155/2015/835985. Epub 2015 Dec 2. PPAR Res. 2015. PMID: 26713088 Free PMC article. Review.
-
Maternal heat stress regulates the early fat deposition partly through modification of m6A RNA methylation in neonatal piglets.Cell Stress Chaperones. 2019 May;24(3):635-645. doi: 10.1007/s12192-019-01002-1. Epub 2019 May 8. Cell Stress Chaperones. 2019. PMID: 31069641 Free PMC article.
-
Doxycycline promotes proteasome fitness in the central nervous system.Sci Rep. 2021 Aug 20;11(1):17003. doi: 10.1038/s41598-021-96540-z. Sci Rep. 2021. PMID: 34417525 Free PMC article.
-
Impact of heat shock transcription factor 1 on global gene expression profiles in cells which induce either cytoprotective or pro-apoptotic response following hyperthermia.BMC Genomics. 2013 Jul 8;14:456. doi: 10.1186/1471-2164-14-456. BMC Genomics. 2013. PMID: 23834426 Free PMC article.
References
-
- Christians ES, Benjamin IJ. Heat shock response: lessons from mouse knockouts. Handbook of experimental pharmacology. 2006. pp. 139–152. full_text. - PubMed
Publication types
MeSH terms
Substances
LinkOut - more resources
Full Text Sources
Molecular Biology Databases
