

Comparative transcriptomic analysis of follicle-enclosed oocyte maturational and developmental competence acquisition in two non-mammalian vertebrates
- PMID: 20059772
- PMCID: PMC2821372
- DOI: 10.1186/1471-2164-11-18
Comparative transcriptomic analysis of follicle-enclosed oocyte maturational and developmental competence acquisition in two non-mammalian vertebrates
Abstract
Background: In vertebrates, late oogenesis is a key period during which the oocyte acquires its ability to resume meiosis (i.e. maturational competence) and to develop, once fertilized, into a normal embryo (i.e. developmental competence). However, the molecular mechanisms involved in these key biological processes are far from being fully understood. In order to identify key mechanisms conserved among teleosts and amphibians, we performed a comparative analysis using ovarian tissue sampled at successive steps of the maturational competence acquisition process in the rainbow trout (Oncorhynchus mykiss) and in the clawed toad (Xenopus laevis). Our study aimed at identifying common differentially expressed genes during late oogenesis in both species. Using an existing transcriptomic analysis that had previously been carried out in rainbow trout, candidate genes were selected for subsequent quantitative PCR-based comparative analysis.
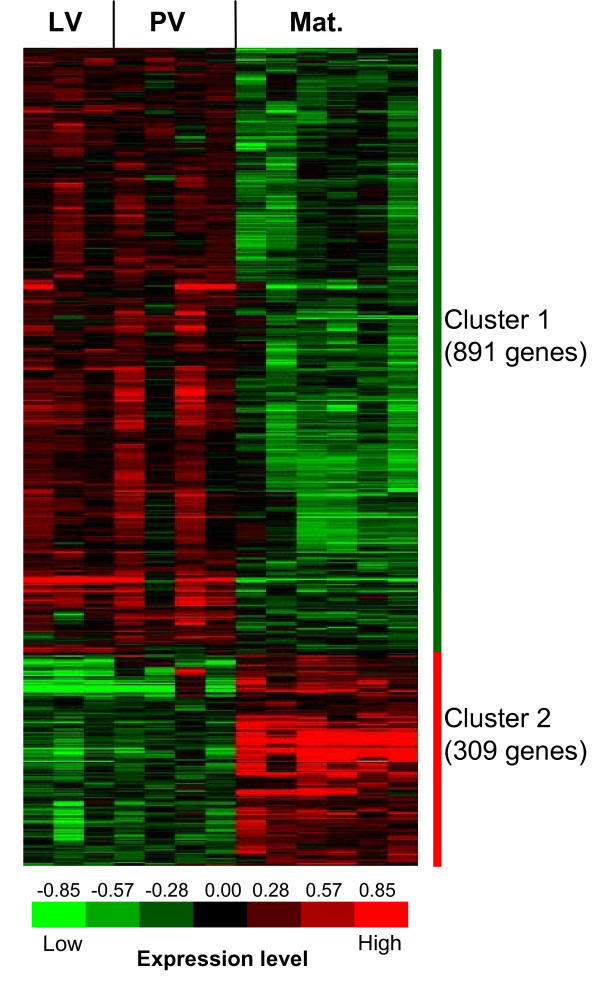
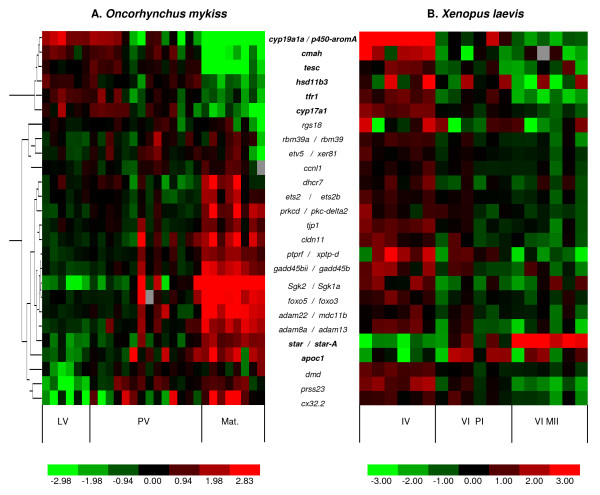
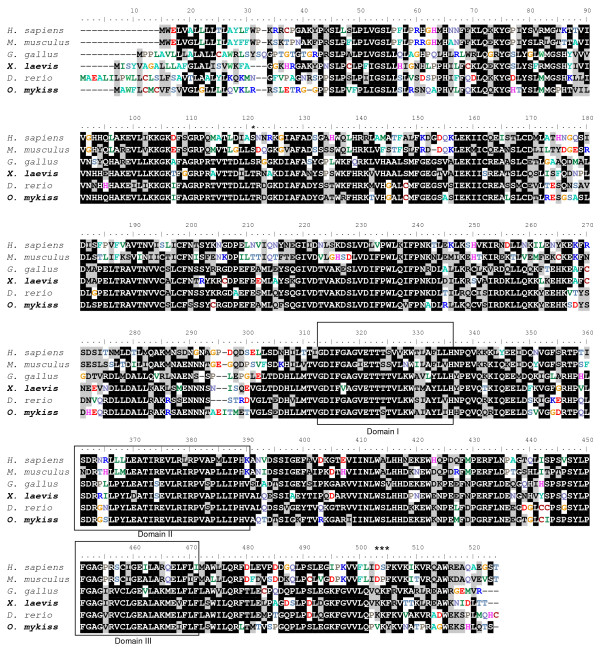
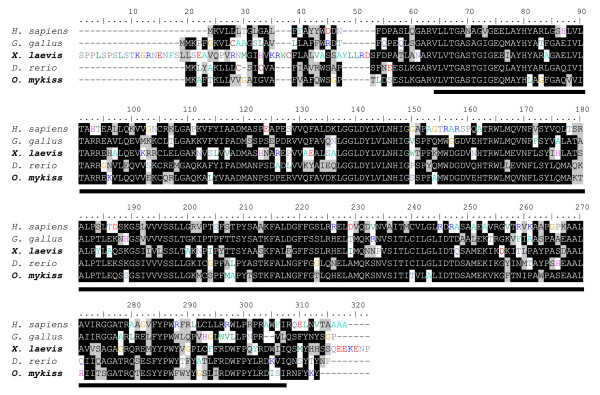
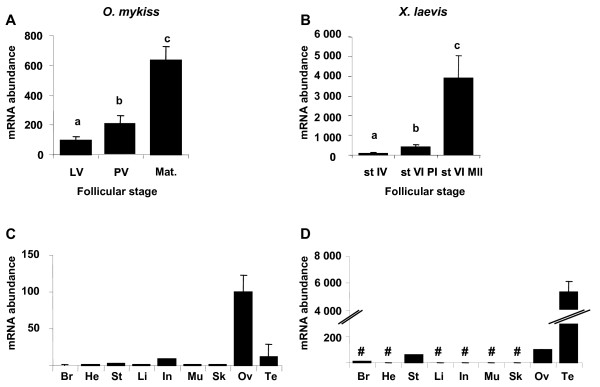
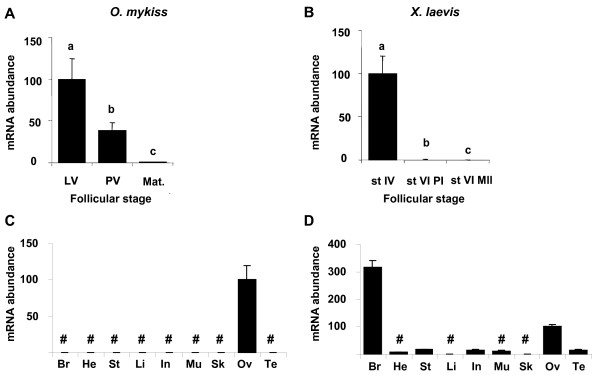
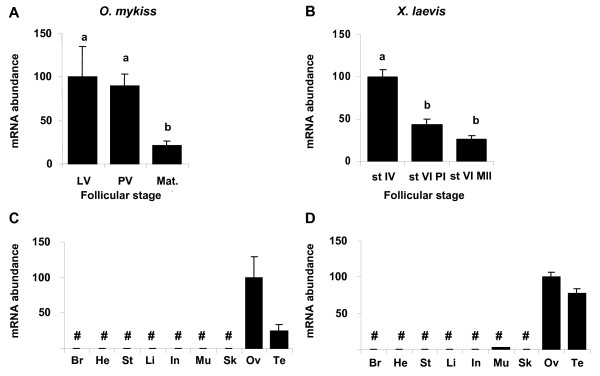
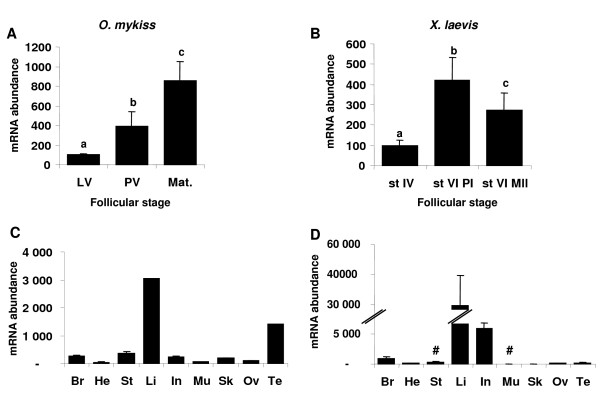
Results: Among the 1200 differentially expressed clones in rainbow trout, twenty-six candidate genes were selected for further analysis by real-time PCR in both species during late oogenesis. Among these genes, eight had similar expression profiles in trout and Xenopus. Six genes were down-regulated during oocyte maturation (cyp19a1, cyp17a1, tescalcin, tfr1, cmah, hsd11b3) while two genes exhibited an opposite pattern (apoc1, star). In order to document possibly conserved molecular mechanisms, four genes (star, cyp19a1, cyp17a1 and hsd11b3) were further studied due to their known or suspected role in steroidogenesis after characterization of the orthology relationships between rainbow trout and Xenopus genes. Apoc1 was also selected for further analysis because of its reported function in cholesterol transport, which may modulate steroidogenesis by regulating cholesterol bioavailability in the steroidogenic cells.
Conclusions: We have successfully identified orthologous genes exhibiting conserved expression profiles in the ovarian follicle during late oogenesis in both trout and Xenopus. While some identified genes were previously uncharacterized during Xenopus late oogenesis, the nature of these genes has pointed out molecular mechanisms possibly conserved in amphibians and teleosts. It should also be stressed that in addition to the already suspected importance of steroidogenesis in maturational competence acquisition, our approach has shed light on other regulatory pathways which may be involved in maturational and developmental competence acquisitions that will require further studies.
Figures


Similar articles
-
Oocyte-somatic cells interactions, lessons from evolution.BMC Genomics. 2012 Oct 19;13:560. doi: 10.1186/1471-2164-13-560. BMC Genomics. 2012. PMID: 23083410 Free PMC article.
-
Identification of new participants in the rainbow trout (Oncorhynchus mykiss) oocyte maturation and ovulation processes using cDNA microarrays.Reprod Biol Endocrinol. 2006 Jul 27;4:39. doi: 10.1186/1477-7827-4-39. Reprod Biol Endocrinol. 2006. PMID: 16872517 Free PMC article.
-
In silico identification and molecular characterization of genes predominantly expressed in the fish oocyte.BMC Genomics. 2008 Oct 23;9:499. doi: 10.1186/1471-2164-9-499. BMC Genomics. 2008. PMID: 18947432 Free PMC article.
-
Ovarian function of the trout preovulatory ovary: new insights from recent gene expression studies.Comp Biochem Physiol A Mol Integr Physiol. 2009 May;153(1):63-8. doi: 10.1016/j.cbpa.2008.10.021. Epub 2008 Nov 6. Comp Biochem Physiol A Mol Integr Physiol. 2009. PMID: 19027867 Review.
-
Global gene expression analysis during bovine oocyte in vitro maturation.Theriogenology. 2007 Sep 1;68 Suppl 1:S91-7. doi: 10.1016/j.theriogenology.2007.04.018. Epub 2007 May 18. Theriogenology. 2007. PMID: 17512044 Review.
Cited by
-
Transcriptome analysis of flathead grey mullet (Mugil cephalus) ovarian development induced by recombinant gonadotropin hormones.Front Physiol. 2022 Nov 1;13:1033445. doi: 10.3389/fphys.2022.1033445. eCollection 2022. Front Physiol. 2022. PMID: 36388126 Free PMC article.
-
Construction, De-Novo Assembly and Analysis of Transcriptome for Identification of Reproduction-Related Genes and Pathways from Rohu, Labeo rohita (Hamilton).PLoS One. 2015 Jul 6;10(7):e0132450. doi: 10.1371/journal.pone.0132450. eCollection 2015. PLoS One. 2015. PMID: 26148098 Free PMC article.
-
Transcriptomic Profiling of Egg Quality in Sea Bass (Dicentrarchus labrax) Sheds Light on Genes Involved in Ubiquitination and Translation.Mar Biotechnol (NY). 2017 Feb;19(1):102-115. doi: 10.1007/s10126-017-9732-1. Epub 2017 Feb 8. Mar Biotechnol (NY). 2017. PMID: 28181038 Free PMC article.
-
Transcriptomic signatures for ovulation in vertebrates.Gen Comp Endocrinol. 2017 Jun 1;247:74-86. doi: 10.1016/j.ygcen.2017.01.019. Epub 2017 Jan 19. Gen Comp Endocrinol. 2017. PMID: 28111234 Free PMC article.
-
Reliable Phylogenetic Trees Building: A New Web Interface for FIGENIX.Evol Bioinform Online. 2012;8:417-21. doi: 10.4137/EBO.S9179. Epub 2012 Jul 5. Evol Bioinform Online. 2012. PMID: 22844195 Free PMC article.
References
-
- Jalabert B, Fostier A, Breton B, Weil C. In: Vertebrate Endocrinology, Fundamentals and Biomedical Implications. Pang P, Schreibman M, editor. Vol. 4. New York: Academic Press; 1991. Oocyte Maturation in Vertebrates; pp. 23–90.
Publication types
MeSH terms
Substances
LinkOut - more resources
Full Text Sources
Molecular Biology Databases
Miscellaneous
