. 2010 Mar 8:1318:110-21.
doi: 10.1016/j.brainres.2009.12.075. Epub 2010 Jan 6.

Altered local coherence in the default mode network due to sevoflurane anesthesia

Affiliations

Altered local coherence in the default mode network due to sevoflurane anesthesia

Gopikrishna Deshpande et al. Brain Res. .

Abstract

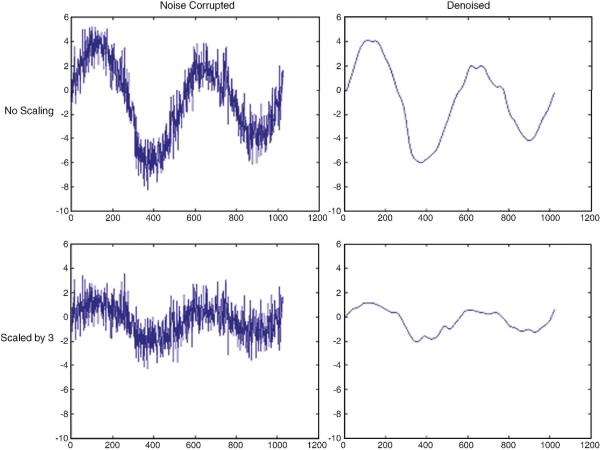
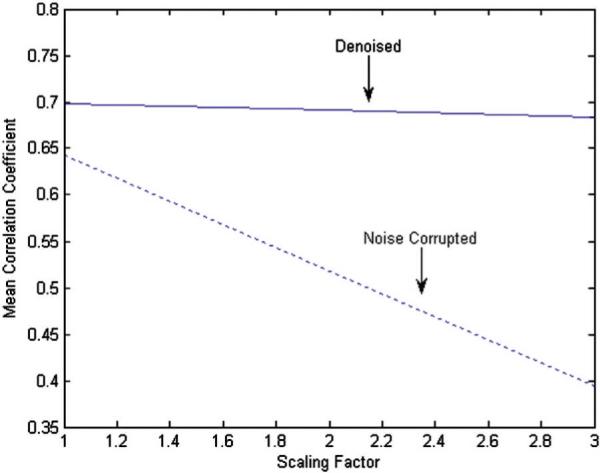
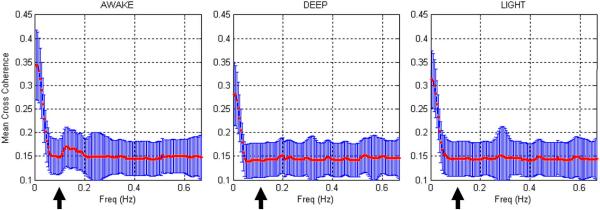
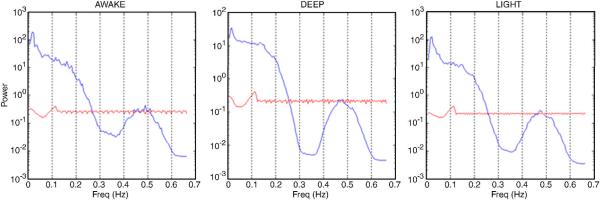
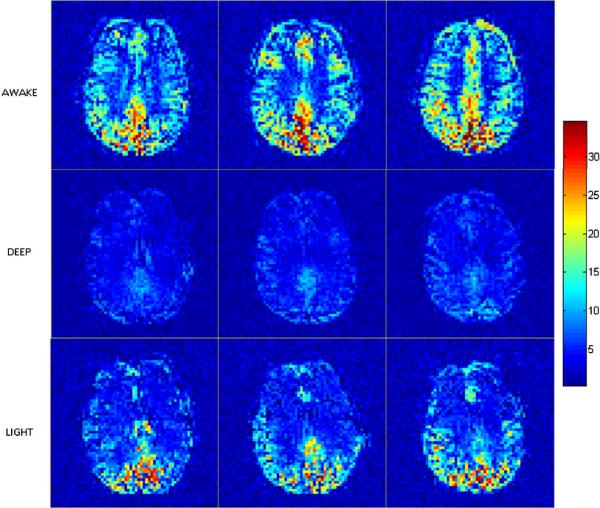
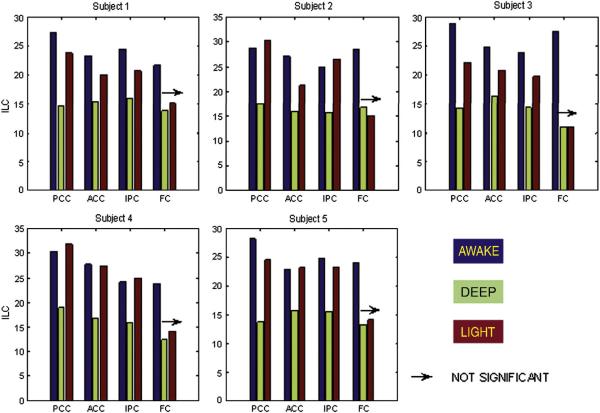
Recently we introduced a robust measure, integrated local correlation (ILC), of local connectivity in the brain using fMRI data which reflects the temporal correlation of brain activity in every voxel neighborhood. The current work studies ILC in fMRI data obtained in the absence and presence of sevoflurane anesthesia (0%, 2%, and 1% end-tidal concentration, respectively) administered to healthy volunteers. ILC was determined specifically in regions of the default mode network (DMN) to address local changes in each state. In addition, a potential confound in analyses based on correlations due to signal-to-noise variations was addressed by wavelet denoising. This accommodated decreases in signal power commonly seen during anesthesia without artificially reducing derived correlations. Results showed that ILC was significantly reduced in the entire DMN during 2% sevoflurane yet recovered in the posterior and anterior cingulate cortices as well as inferior parietal cortex during 1% sevoflurane. By contrast, ILC remained attenuated prefrontally in the 1% condition, which indicates uncoupling of the frontal areas of DMN during light anesthesia. These results confirm widespread anesthetic-induced cortical suppression but also demonstrate that the local connectivity of the prefrontal cortex is rapidly reduced by sevoflurane. It remains to be seen whether these alterations arise locally as a direct consequence of anesthetic action on local neurons or are driven by distant changes in oscillations and activity elsewhere in the brain.


Figures

Figure A1
Figure A1
Original (top) and scaled (bottom) time series x(t) with and without denoising (right and left panels, respectively). This illustrates the effectiveness of wavelet denoising for removing only the random fluctuations introduced by noise while retaining the signal of interest.
Figure A2
Figure A2
The variation of mean R′ (dotted line) and R″ (solid line) as a function of the scaling factor. This illustrates that, in the presence of noise, a decrease in signal amplitude (i.e. increase in scaling factor) can lead to artificially reduced correlation even though the synchrony between the signals remain unaltered. With wavelet denoising, the dependence of correlation on signal amplitude is largely reduced as shown by the relatively flat line obtained from denoised data
Figure A3
Figure A3
The autocorrelation functions of the difference time series between the original and denoised signals inside the brain (solid line) and the mean time series outside the brain (dotted line) obtained from fMRI data acquired during the deep anesthetic state. The difference time series between the original and denoised signals inside the brain is a measure of the noise removed by wavelet denoising from brain tissue. The mean time series outside the brain represents the measurement noise introduced by the scanner. Since the autocorrelation function, which is a signature of noise characteristics, of both the time series were closely matched, it can be inferred that wavelet denoising removed only the measurement noise and not the signal of interest from the brain tissue.
Figure 1
Figure 1
The cross coherence function obtained from all the subjects in the awake (left), deep (middle) and light (right) states. The mean curve is shown in red and standard deviation as blue bars. The cross coherence function provides a frequency-specific decomposition of ILC. The high frequency coherence components (>0.1 Hz), which typically contain the effects of physiological artifacts, were significantly lesser in magnitude and remained relatively constant between the three states in comparison to the low frequency coherence components (<0.1 Hz) which are thought to be physiologically relevant. The arrow in the figure shows the cut off frequency of 0.1 Hz. Therefore, it can be inferred that the ILC differences between the three states were mainly driven by the differences in the low frequency coherence components
Figure 2
Figure 2
The mean power spectra of the fMRI time series inside the brain (blue) and the downsampled physiological time series (red) for the awake (left), deep (middle) and light (right) states. Note that the power on the y-axis is represented on a logarithmic scale and is different for the deep state in order to highlight the fact that downsampled physiological time series had a power less than one compared to a power of 10–100 for fMRI time series inside the brain. Therefore, it can be inferred that downsampling did not alias the physiological rhythms into the low frequency band (<0.1 Hz)
Figure 3
Figure 3
Group ILC maps for the awake (top), deep (middle) and light (bottom) anesthetic states in EPI space. Slices containing the default mode network are displayed. ILC was greater in areas of high metabolism such as posterior cingulate in the awake state. Global reduction of ILC was observed in the deep state. ILC recovered in the posterior areas in the light state, but remained attenuated in the frontal areas
Figure 4
Figure 4
ROI-specific ILC values for all the five subjects. The awake and deep states were statistically different (p<0.05) for each ROI in every subject while the deep and light states were statistically different (p<0.05) for PCC, ACC and IPC in all the subjects. The arrow indicates that the ILC transition from deep to light state was not significant (p>0.05) for FC in all subjects. PCC: Posterior cingulate cortex, ACC: Anterior cingulate cortex, IPC: Inferior parietal cortex, FC: Frontal cortex. The color of the bar indicates the anesthetic state. Blue: awake, Green: deep and Red: light
Figure 5
Figure 5
The resting-state default mode mask in MNI space. Abbreviations – PCC: posterior cingulate cortex, ACC: anterior cingulate cortex, IPC: inferior parietal cortex, FC: frontal cortex, BA: Brodmann area

Similar articles

Cited by

References

    1. Alkire MT, Haier RJ, Barker SJ, Shah NK, Wu JC, Kao YJ. Cerebral metabolism during propofol anesthesia in humans studied with positron emission tomography. Anesthesiology. 1995;82:393–403. - PubMed
    1. Alkire MT, Gruver R, Miller J, McReynolds JR, Hahn EL, Cahill L. Neuroimaging analysis of an anesthetic gas that blocks human emotional memory. Proc Natl Acad Sci USA. 2008a;105(5):1722–1727. - PMC - PubMed
    1. Alkire MT, Gruver RL, Cahill L. Desflurane suppresses human working memory areas without changing amygdala-hippocampal connectivity. Anesthesiology. 2008b;109:A835.
    1. Alkire MT, Hudetz AG, Tononi G. Consciousness and anesthesia. Science. 2008;322(5903):876–880. - PMC - PubMed
    1. Biswal B, Yetkin FZ, Haughton VM, Hyde JS. Functional connectivity in the motor cortex of resting human brain using echo-planar MRI. Magnetic Resonance in Medicine. 1995;34:537–541. - PubMed

Publication types

MeSH terms