Functional electrical stimulation helps replenish progenitor cells in the injured spinal cord of adult rats
- PMID: 20059998
- PMCID: PMC2834811
- DOI: 10.1016/j.expneurol.2009.12.029
Functional electrical stimulation helps replenish progenitor cells in the injured spinal cord of adult rats
Abstract
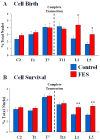
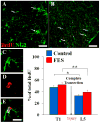
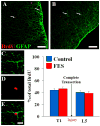
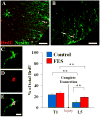
Functional electrical stimulation (FES) can restore control and offset atrophy to muscles after neurological injury. However, FES has not been considered as a method for enhancing CNS regeneration. This paper demonstrates that FES dramatically enhanced progenitor cell birth in the spinal cord of rats with a chronic spinal cord injury (SCI). A complete SCI at thoracic level 8/9 was performed on 12 rats. Three weeks later, a FES device to stimulate hindlimb movement was implanted into these rats. Twelve identically-injured rats received inactive FES implants. An additional control group of uninjured rats were also examined. Ten days after FES implantation, dividing cells were marked with bromodeoxyuridine (BrdU). The "cell birth" subgroup (half the animals in each group) was sacrificed immediately after completion of BrdU administration, and the "cell survival" subgroup was sacrificed 7 days later. In the injured "cell birth" subgroup, FES induced an 82-86% increase in cell birth in the lumbar spinal cord. In the injured "cell survival" subgroup, the increased lumbar newborn cell counts persisted. FES doubled the proportion of the newly-born cells which expressed nestin and other markers suggestive of tripotential progenitors. In uninjured rats, FES had no effect on cell birth/survival. This report suggests that controlled electrical activation of the CNS may enhance spontaneous regeneration after neurological injuries.
Keywords: cell birth; exercise; neural activity; regeneration; rehabilitation; spinal cord injury; stem cell.
Copyright 2010 Elsevier Inc. All rights reserved.
Figures

Similar articles
-
Implantation of dendritic cells in injured adult spinal cord results in activation of endogenous neural stem/progenitor cells leading to de novo neurogenesis and functional recovery.J Neurosci Res. 2004 May 15;76(4):453-65. doi: 10.1002/jnr.20086. J Neurosci Res. 2004. PMID: 15114617
-
Functional electrical stimulation post-spinal cord injury improves locomotion and increases afferent input into the central nervous system in rats.J Spinal Cord Med. 2014 Jan;37(1):93-100. doi: 10.1179/2045772313Y.0000000117. Epub 2013 Nov 26. J Spinal Cord Med. 2014. PMID: 24090649 Free PMC article.
-
Stem cells in the adult rat spinal cord: plasticity after injury and treadmill training exercise.J Neurochem. 2010 Feb;112(3):762-72. doi: 10.1111/j.1471-4159.2009.06500.x. Epub 2009 Nov 18. J Neurochem. 2010. PMID: 19925583
-
[Electrical stimulation promote proliferation and differentiation of endogenous neural stem cells in normal and injured spinal cord].Zhen Ci Yan Jiu. 2008 Feb;33(1):34-6, 40. Zhen Ci Yan Jiu. 2008. PMID: 18386642 Review. Chinese.
-
Spinal cord injury: present and future therapeutic devices and prostheses.Neurotherapeutics. 2008 Jan;5(1):147-62. doi: 10.1016/j.nurt.2007.10.062. Neurotherapeutics. 2008. PMID: 18164494 Free PMC article. Review.
Cited by
-
Electroacupuncture promotes the proliferation of endogenous neural stem cells and oligodendrocytes in the injured spinal cord of adult rats.Neural Regen Res. 2012 May 25;7(15):1138-44. doi: 10.3969/j.issn.1673-5374.2012.15.003. Neural Regen Res. 2012. PMID: 25722706 Free PMC article.
-
Protein and Polysaccharide-Based Electroactive and Conductive Materials for Biomedical Applications.Molecules. 2021 Jul 26;26(15):4499. doi: 10.3390/molecules26154499. Molecules. 2021. PMID: 34361653 Free PMC article. Review.
-
Efficacy of Electrical Stimulation-Augmented Virtual Reality Training in Improving Balance in Individuals with Incomplete Spinal Cord Injury: Study Protocol of a Randomized Controlled Trial.Asian Spine J. 2021 Dec;15(6):865-873. doi: 10.31616/asj.2020.0047. Epub 2020 Dec 30. Asian Spine J. 2021. PMID: 33371624 Free PMC article.
-
Regeneration and Plasticity Induced by Epidural Stimulation in a Rodent Model of Spinal Cord Injury.Int J Mol Sci. 2024 Aug 21;25(16):9043. doi: 10.3390/ijms25169043. Int J Mol Sci. 2024. PMID: 39201729 Free PMC article.
-
Electrical stimulation for the treatment of spinal cord injuries: A review of the cellular and molecular mechanisms that drive functional improvements.Front Cell Neurosci. 2023 Feb 3;17:1095259. doi: 10.3389/fncel.2023.1095259. eCollection 2023. Front Cell Neurosci. 2023. PMID: 36816852 Free PMC article. Review.
References
-
- Ahlborn P, Schachner M, Irintchev A. One hour electrical stimulation accelerates functional recovery after femoral nerve repair. Exp Neurol. 2007;208:137–144. - PubMed
-
- Barres BA, Raff MC. Proliferation of oligodendrocyte precursor cells depends on electrical activity in axons. Nature. 1993;361:258–260. - PubMed
-
- Bjugn R, Gundersen HJ. Estimate of the total number of neurons and glial and endothelial cells in the rat spinal cord by means of the optical disector. J Comp Neurol. 1993;328:406–414. - PubMed
Publication types
MeSH terms
Substances
Grants and funding
LinkOut - more resources
Full Text Sources
Medical
Miscellaneous

