Review
. 2010 Apr 26;100(1):55-62.
doi: 10.1016/j.physbeh.2009.12.021. Epub 2010 Jan 6.

High-intensity sweeteners and energy balance

Affiliations
Review

High-intensity sweeteners and energy balance

Susan E Swithers et al. Physiol Behav. .

Abstract

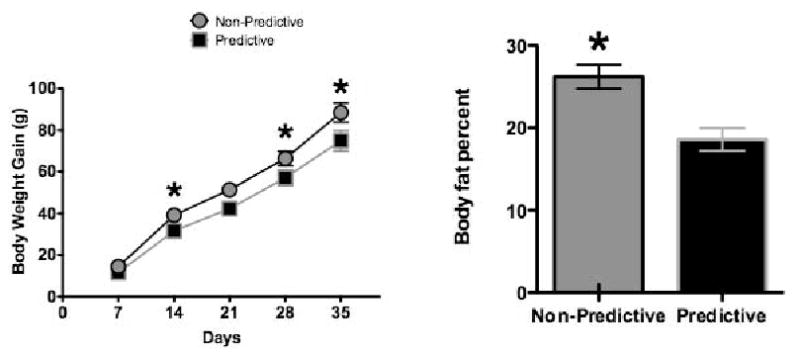
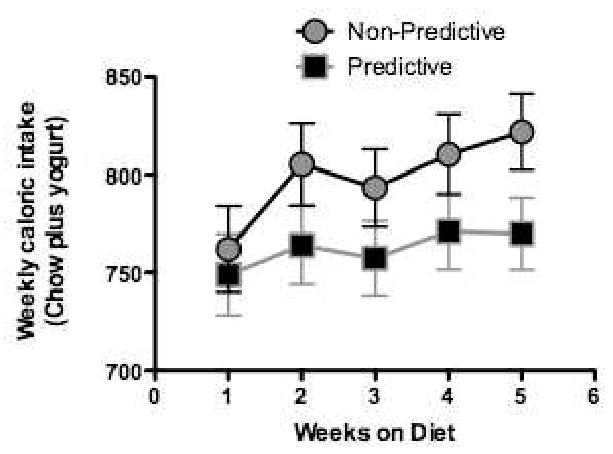
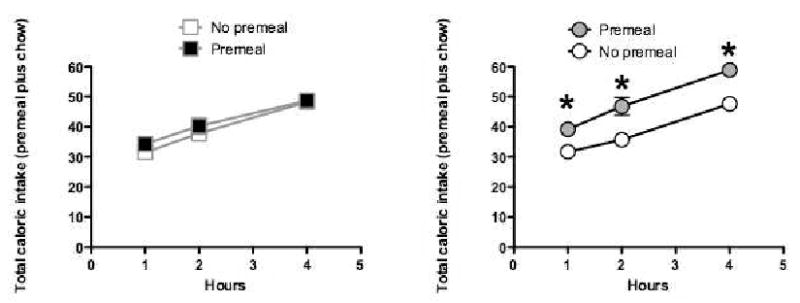
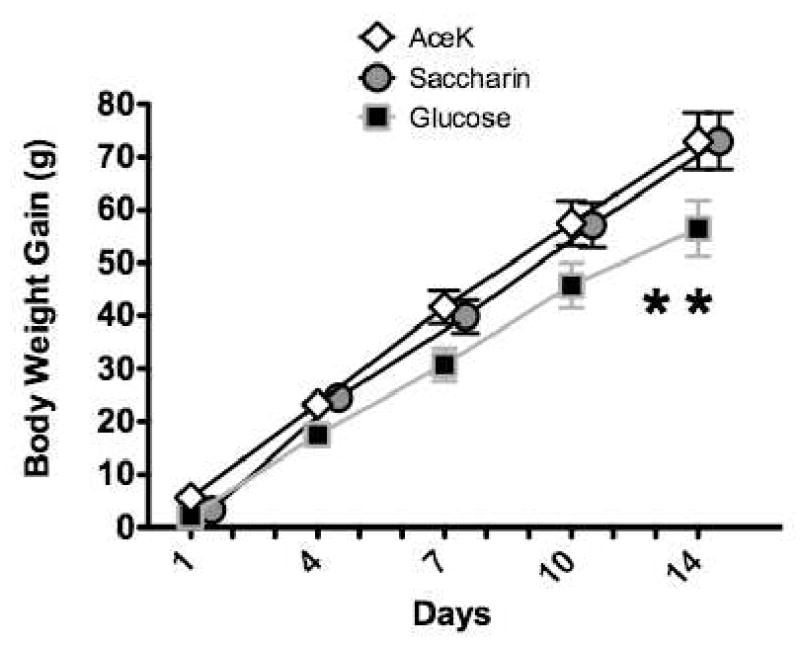
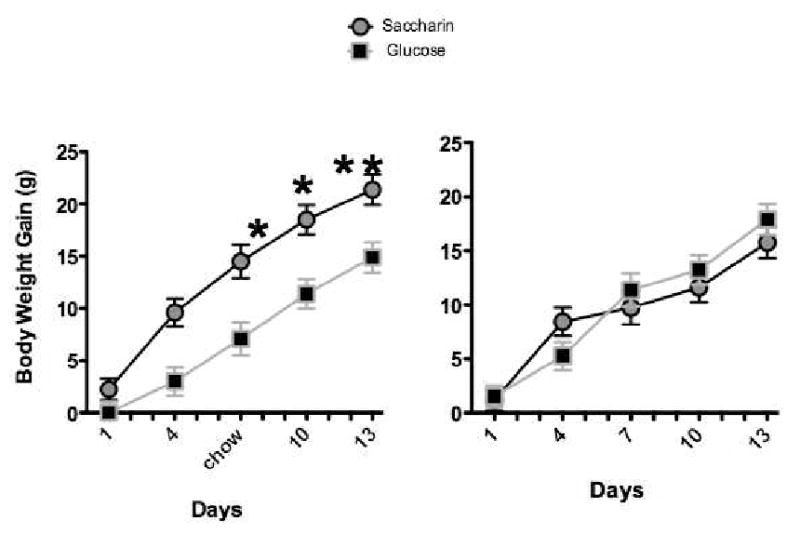
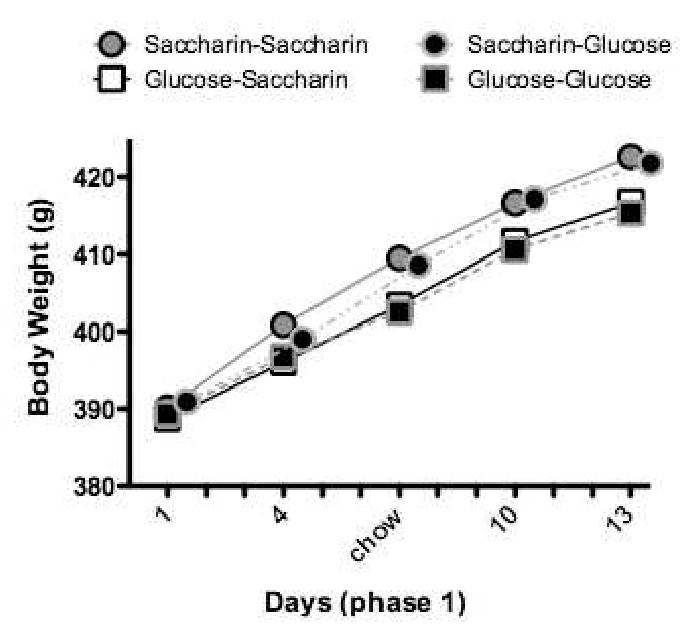
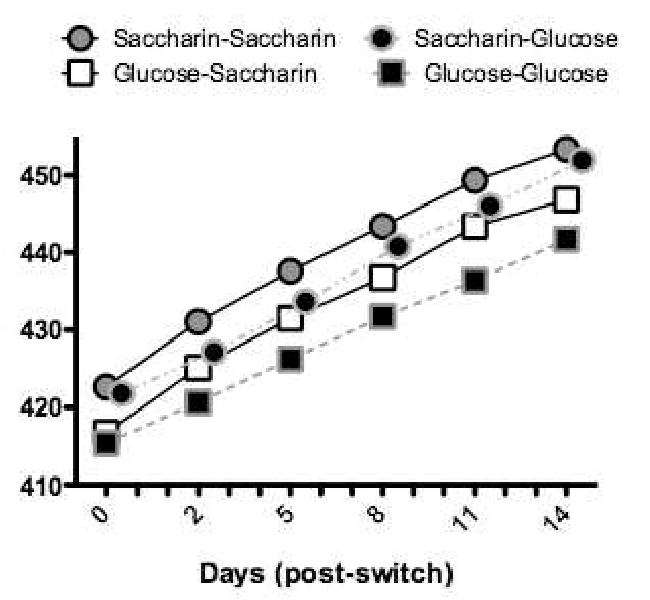
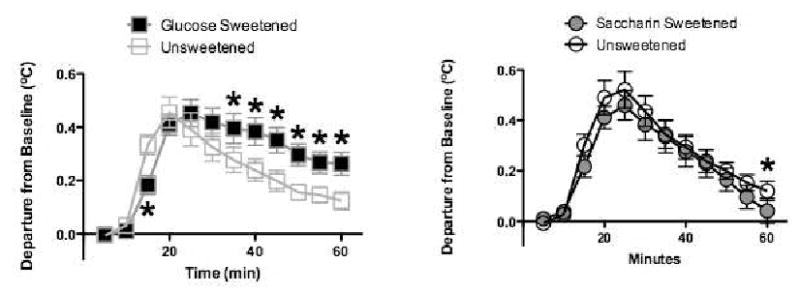
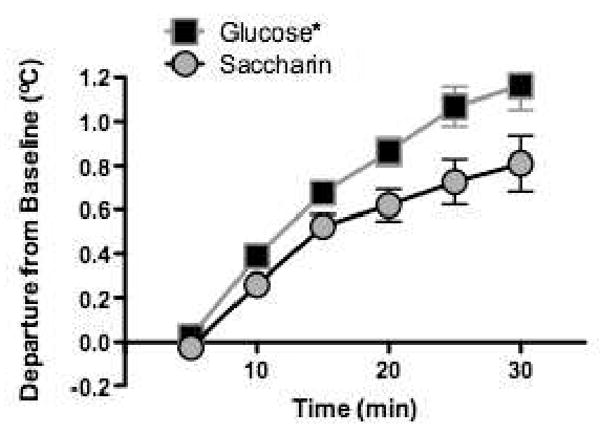
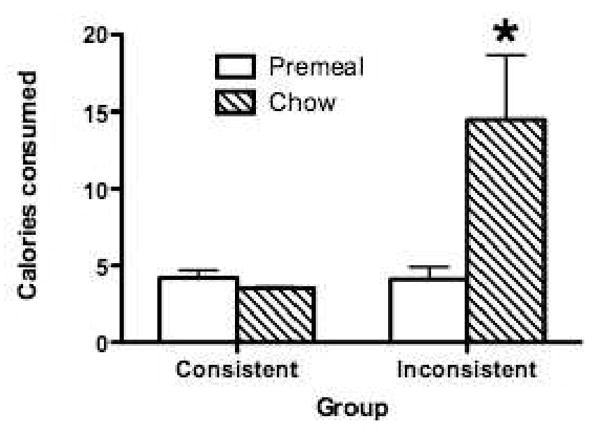
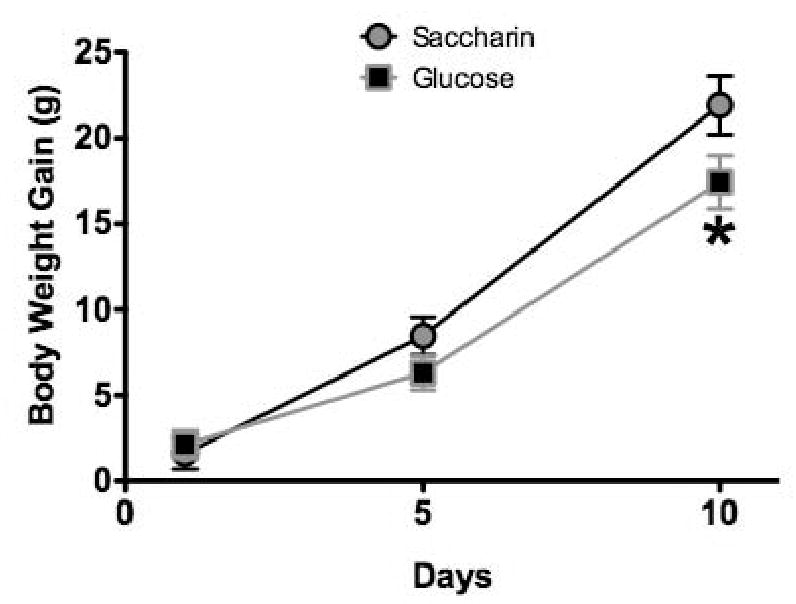
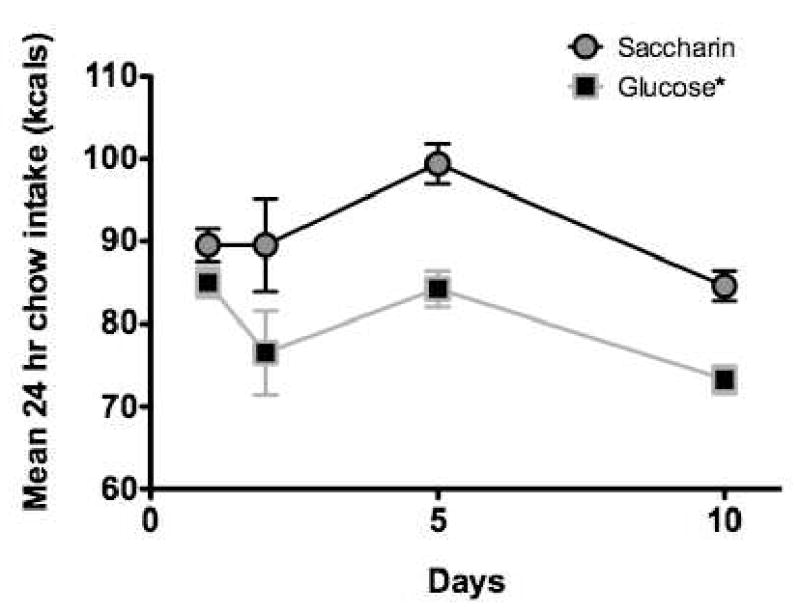
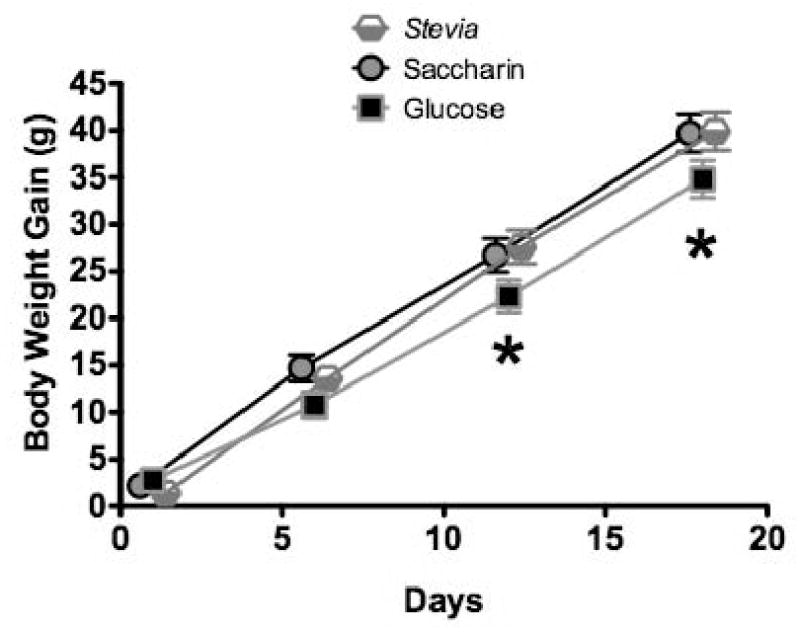
Recent epidemiological evidence points to a link between a variety of negative health outcomes (e.g. metabolic syndrome, diabetes and cardiovascular disease) and the consumption of both calorically sweetened beverages and beverages sweetened with high-intensity, non-caloric sweeteners. Research on the possibility that non-nutritive sweeteners promote food intake, body weight gain, and metabolic disorders has been hindered by the lack of a physiologically-relevant model that describes the mechanistic basis for these outcomes. We have suggested that based on Pavlovian conditioning principles, consumption of non-nutritive sweeteners could result in sweet tastes no longer serving as consistent predictors of nutritive postingestive consequences. This dissociation between the sweet taste cues and the caloric consequences could lead to a decrease in the ability of sweet tastes to evoke physiological responses that serve to regulate energy balance. Using a rodent model, we have found that intake of foods or fluids containing non-nutritive sweeteners was accompanied by increased food intake, body weight gain, accumulation of body fat, and weaker caloric compensation, compared to consumption of foods and fluids containing glucose. Our research also provided evidence consistent with the hypothesis that these effects of consuming saccharin may be associated with a decrement in the ability of sweet taste to evoke thermic responses, and perhaps other physiological, cephalic phase, reflexes that are thought to help maintain energy balance.


Figures

Figure 1
Figure 1
Body weight gain (left) and adiposity (right) were significantly greater in rats (n's = 8 – 9 per group) given access to saccharin-sweetened yogurt diet supplements in which sweet taste did not predict increased calories (Non-Predictive group) compared to animals given glucose-sweetened yogurt diet supplements (Predictive group) in which sweet taste did reliably predict increased calories. Adapted from . Used with permission. * p < 0.05 compared to Predictive
Figure 2
Figure 2
Total caloric intake tended to be greater in rats given access to saccharin-sweetened yogurt diet supplements in which sweet taste did not predict increased calories (Non-Predictive group) compared to animals given glucose-sweetened yogurt diet supplements (Predictive group) in which sweet taste did reliably predict increased calories (n's = 8 – 9 per group). Adapted from . Used with permission.
Figure 3
Figure 3
Rats given experience with Predictive experience with sweet tastes and calories (left) showed strong caloric compensation for calories provided in a novel, sweet tasting premeal. Total caloric intake was not significantly different on days when a premeal was provided compared to days on which a premeal was not provided. In contrast, rats given experience with Non-Predictive relations between sweet taste and calories (right) failed to compensate for calories provided in a novel sweet premeal (n's = 8 – 9 per group). Adapted from . Used with permission. * p< 0.05 compared to No Premeal
Figure 4
Figure 4
Body weight gain was significantly greater in rats given yogurts sweetened with saccharin or AceK compared to rats given yogurts sweetened with glucose (n's = 8 per group). Adapted from . Used with permission. * p < 0.05 compared to AceK and Saccharin
Figure 5
Figure 5
Body weight gain was significantly greater during 2 weeks exposure (left) to saccharin-sweetened yogurt compared to glucose-sweetened yogurt. Following discontinuation of yogurt access (right), animals in the saccharin-sweetened group failed to compensate for the prior excess weight gain (n=13 per group). Adapted from . Used with permission. * p < 0.05 compared to Glucose
Figure 6
Figure 6
During exposure to yogurt or refried beans diets sweetened with saccharin, body weight gain was significantly greater compared to the same base diets sweetened with glucose (n's = 12-14 per group). Adapted from Adapted from . Used with permission.
Figure 7
Figure 7
Body weight gain in all rats given saccharin-sweetened yogurt or refried beans was significantly greater compared to animals given access to glucose-sweetened diets (n's =12- 14 per group). Adapted from Adapted from . Used with permission.
Figure 8
Figure 8
Increases in core body temperature across two weeks of exposure to plain, unsweetened yogurt and yogurt sweetened with glucose (left) or saccharin (right) (n's =6 – 8 per group). Adapted from . Used with permission. *p < 0.05 compared to unsweetened yogurt
Figure 9
Figure 9
Increases in core body temperature following a premeal of a novel, sweet diet were significantly higher in animals with previous experience consuming glucose-sweetened yogurt diets compared to animals with previous experience consuming saccharin-sweetened yogurt diets (n's =6 – 8 per group). Adapted from . Used with permission. *p < 0.05 compared to saccharin group
Figure 10
Figure 10
In juvenile rats given experience with Inconsistent relations between sweet taste and calories (glucose and saccharin solutions), chow intake following a novel, sweet premeal was significantly greater compared to juvenile rats given previous experience with Consistent relations between sweet taste and calories (glucose and sucrose solutions; n = 10 per group). Adapted from . Used with permission. * p < 0.05 compared to Consistent group
Figure 11
Figure 11
Body weight gain was significantly greater in rats (n = 13- 16 per group) following 10 days exposure to saccharin solutions compared to glucose solutions. * p < 0.05 compared to saccharin
Figure 12
Figure 12
Chow intake was significantly greater during 10 days exposure to in saccharin solutions compared to 10 days exposure to glucose solutions (n = 13- 16 per group). * p <0.05 compared to saccharin
Figure 13
Figure 13
Body weight gain was significantly greater in animals consuming either saccharin solutions or Stevia solutions compared to animals consuming glucose solutions (n=18 per group). * p< 0.05 compared to saccharin or Stevia

References

    1. Chen L, Appel LJ, Loria C, Lin PH, Champagne CM, Elmer PJ, Ard JD, Mitchell D, Batch BC, Svetkey LP, et al. Reduction in consumption of sugar-sweetened beverages is associated with weight loss: the PREMIER trial. Am J Clin Nutr. 2009;89(5):1299–306. - PMC - PubMed
    1. Dhingra R, Sullivan L, Jacques PF, Wang TJ, Fox CS, Meigs JB, D'Agostino RB, Gaziano JM, Vasan RS. Soft drink consumption and risk of developing cardiometabolic risk factors and the metabolic syndrome in middle-aged adults in the community. Circulation. 2007;116(5):480–8. - PubMed
    1. Dubois L, Farmer A, Girard M, Peterson K. Regular sugar-sweetened beverage consumption between meals increases risk of overweight among preschool-aged children. J Am Diet Assoc. 2007;107(6):924–34. discussion 934-5. - PubMed
    1. Fung TT, Malik V, Rexrode KM, Manson JE, Willett WC, Hu FB. Sweetened beverage consumption and risk of coronary heart disease in women. Am J Clin Nutr. 2009;89(4):1037–42. - PMC - PubMed
    1. Malik VS, Schulze MB, Hu FB. Intake of sugar-sweetened beverages and weight gain: a systematic review. Am J Clin Nutr. 2006;84(2):274–88. - PMC - PubMed

Publication types

MeSH terms

Substances