. 2010 May;12(3):268-81.
doi: 10.1016/j.ymben.2009.12.004. Epub 2010 Jan 6.

A genomic-library based discovery of a novel, possibly synthetic, acid-tolerance mechanism in Clostridium acetobutylicum involving non-coding RNAs and ribosomal RNA processing

Affiliations

A genomic-library based discovery of a novel, possibly synthetic, acid-tolerance mechanism in Clostridium acetobutylicum involving non-coding RNAs and ribosomal RNA processing

Jacob R Borden et al. Metab Eng. 2010 May.

Abstract

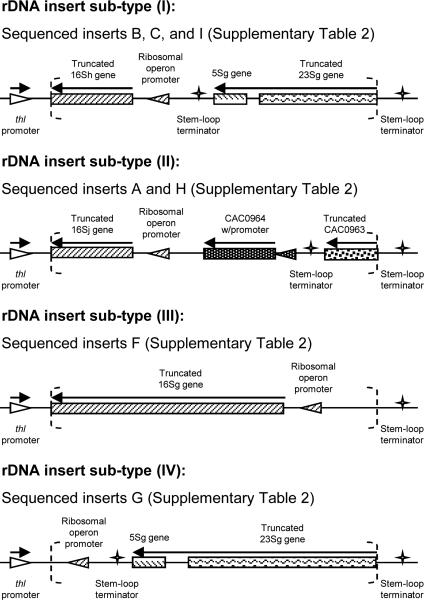
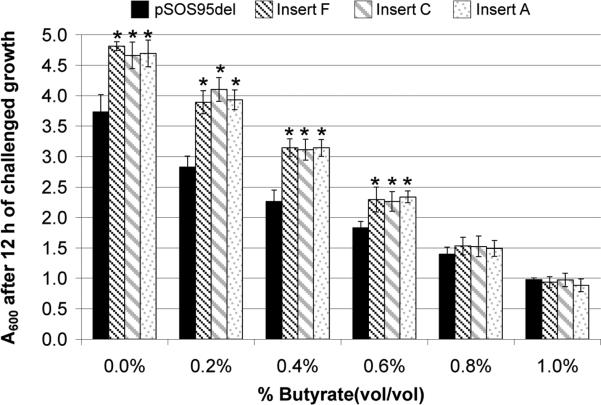
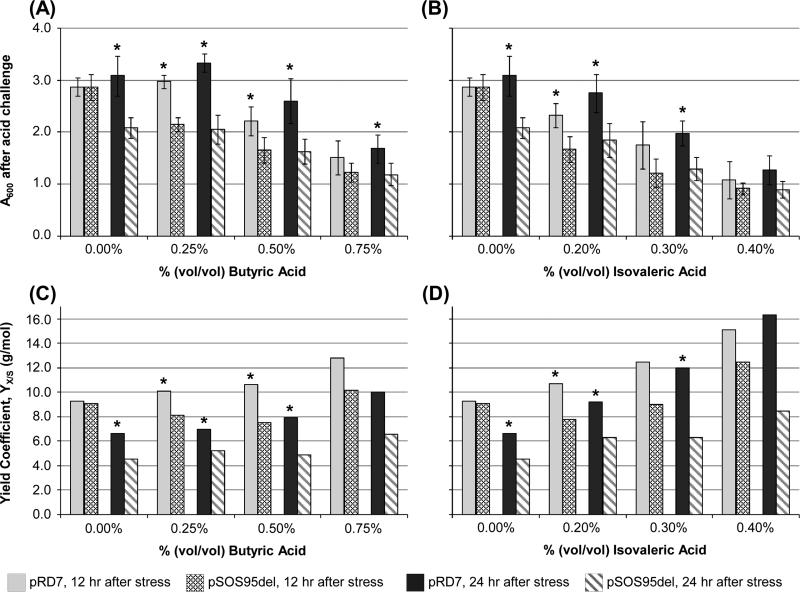
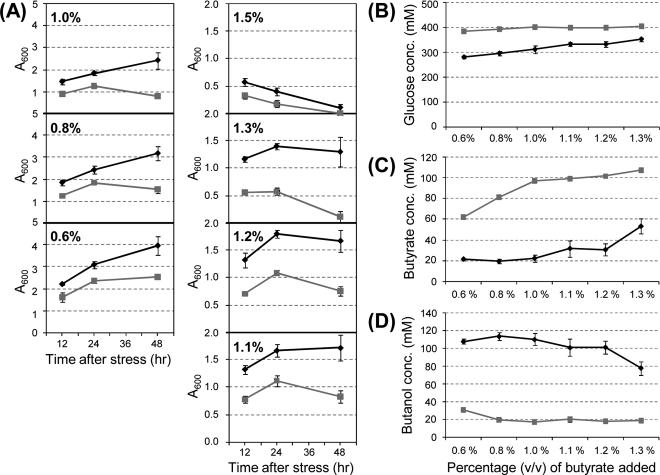
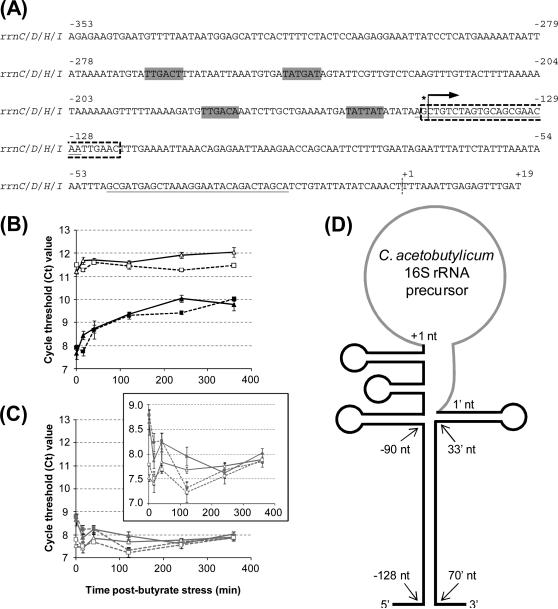
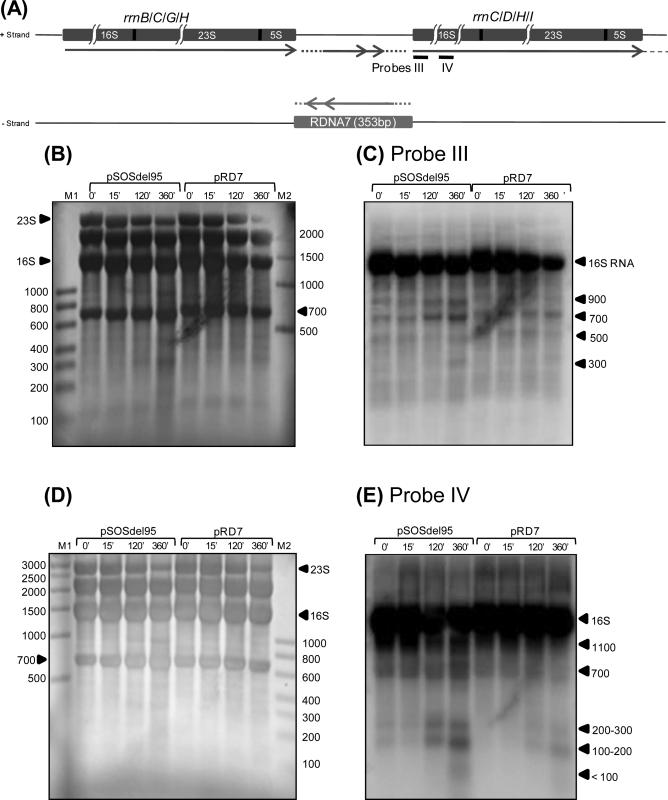
We generated a genomic library from sheared Clostridium acetobutylicum ATCC 824 DNA, whereby inserts can be expressed in both directions from the thiolase promoter, P(thl). Serial transfer of library-bearing C. acetobutylicum cultures exposed to increasing butyrate concentrations enriched for inserts containing fragments of rRNA genetic loci. The selected library inserts were placed so that antisense (to the rRNAs) non-coding RNAs (ncRNAs) would be transcribed from P(thl). Different enriched inserts imparted similar butyrate-tolerance characteristics. A minimal tolerance fragment (RDNA7) was identified as the 16S-rRNA promoter region. Expressed on plasmid pRD7 off P(thl), RDNA7 can produce putative ncRNAs termed ncRNA(RD7). C. acetobutylicum 824(pRD7) showed superior resistance to butyrate and other carboxylic acids. Transcriptional analysis of butyrate stress identified 120 differentially expressed genes between 824(pRD7) and 824(pSOS95del). The few upregulated genes included the ffh gene of the putative signal recognition particle (SRP) system. Northern analysis of ncRNA(RD7) and corresponding antisense RNAs demonstrated multiple ncRNA(RD7) molecules in 824(pRD7). Several corresponding antisense RNA molecules were identified both in 824(pRD7) and 824(pSOS95del), but at much higher levels in 824(pRD7). Northern analysis of 16S rRNA expression suggested complex RDNA7-dependent rRNA processing. Our data suggest that by hybridizing against unprocessed rRNA precursors, ncRNA(RD7) alters rRNA processing, and these alterations result in acid tolerance, possibly through a mechanism involving the Ffh protein.


Figures

Fig. 1
Fig. 1
Cartoon of butyrate-enriched genomic fragments from the library. Regions between the dashed brackets indicate the library inserts, which are flanked by the thl promoter and a rho-independent terminator. All inserts contain part, if not all, of the 5’ upstream region of the 16S ribosomal RNA gene, which includes the promoter for the ribosomal operon (16S-23S-5S).
Fig. 2
Fig. 2
Optical density measurements (A600) of butyrate-challenged cultures of C. acetobutylicum harboring enriched genomic library inserts A, C, and F and plasmid control strain pSOS95del. All optical density measurements were taken after 12 hours of growth following the butyrate stress. Measurements were taken from two biological replicates, with four technical replicates for each biological replicate (total of eight measurements). Values shown are the average of all eight measurements and the standard deviation between those eight measurements. Asterisks indicate statistically significant differences between the genomic library inserts and the plasmid control (p-values ≤ 0.05).
Fig. 3
Fig. 3
Optical density measurements (A600) and yield coefficients, YX/S (g/mol), of C. acetobutylicum (pRD7) and (pSOS95del) challenged with 0.00%, 0.25%, 0.50%, and 0.75% (v/v) of butyric acid (pH 6.7) (A&C) and 0.00%, 0.20%, 0.30%, and 0.40% (v/v) of isovaleric acid (pH 6.7) (B&D). A600 measurements were taken 12 hours and 24 hours following acid stress (A&B). The initial A600 measurements (~1.0) were subtracted off the measurements after 12 and 24 hours so that only growth after acid challenge is shown. Measurements were taken from two biological replicates, with two technical replicates for each biological replicate (total of four measurements). Error bars show the standard deviation between the measurements. For the yield coefficients (C&D), the A600 values were converted into dry cell weight per volume (g/L) and divided by the amount of glucose consumed (mol/L). Raw data for the yield coefficients is in Supplementary Table 4. Asterisks indicate statistically significant differences between 824(pRD7) and 824(pSOS95del) (p-values ≤ 0.05).
Fig. 4
Fig. 4
Preconditioning the culture at sub-lethal levels of butyrate demonstrates the large tolerance advantage of C. acetobutylicum (pRD7) against the control strain. Two biological replicate cultures were grown to an A600 of 1.0 under 0.6% (v/v) butyrate stress, and then split into three technical replicates each and subjected to the different butyrate stress levels. (A) Optical density measurements from the two strains were taken 12, 24, and 48 hrs after stress. The initial A600 measurements (~1.0) were subtracted off the measurements so that only growth after acid challenge is shown. Residual glucose (B), butyrate (C) along with butanol production (D) were also measured after 48 hrs of growth under stress. A600 values of 1 correspond to one culture doubling and 3 to two doublings after the additional stress. The glucose levels in the cultures prior to the additional stress were 451 (± 3.2) mM, while the butanol and butyrate levels were ca. 2.8 (± 0.3) mM, and 53 (± 0.9) mM, respectively. Error bars show the standard deviation between the measurements.
Fig. 5
Fig. 5
Nucleotide sequence of RDNA7 and Q-RT-PCR analysis of its expression. (A) Nucleotide sequence of the four RDNA7 sequences found on the genome. Gray boxes indicate predicted −10 and −35 binding sites for σA. The asterisk and arrow indicate predicted transcriptional start site for the rRNA operon, while the dashed vertical line indicates the start of the mature 16S rRNA. Dashed box region indicates the region probed for the Northern analysis (Fig. 6). Q-RT-PCR primers were designed for the underlined sequences. (B) Q-RT-PCR analysis of RDNA7 in C. acetobutylicum (pRD7), both under butyrate stress (solid black triangle) and unstressed (solid black square), and (pSOS95del), both under butyrate stress (open black triangle) and unstressed (open black square). (C) Q-RT-PCR analysis of 16S rRNA in C. acetobutylicum (pRD7), both under butyrate stress (solid gray triangle) and unstressed (solid gray square), and (pSOS95del), both under butyrate stress (open gray triangle) and unstressed (open gray square). Cycle threshold (Ct) values are the average between two biological replicates for each condition and three technical replicates on the PCR plate for each biological replicate (total of 6 values for each condition). Error bars show the standard error between the values. The scales for the graphs in (B) and (C) were kept the same in order to enable easy comparison of Ct values for the pRD7 vs. the 16S rRNA. The insert with the more narrow scale of the Ct axis is to allow better comparison among the two strains and two conditions for the Ct values of 16S rRNA. (D) Predicted folding structure of the precursor 16S rRNA. Black lines indicate sequences trimmed off of the mature 16S rRNA (gray line). Negative numbers indicate nucleotides upstream of the mature 16S rRNA, while primed numbers indicate nucleotides downstream of the mature 16S rRNA.
Fig. 6
Fig. 6
Northern blot analysis of RDNA7 and its complementary transcript. Oligonucleotide radio-labeled probes were prepared for both the RDNA7 transcript (probe I) and its complementary transcript (probe II) (A). The RDNA7 probe was designed for the transcript produced from pRD7 and the potential native transcript on the negative strand of the intergenic region between RNA operons rrnB/C, rrnC/D, rrnG/H, and rrnH/I. A probe was also designed for the complementary RDNA7 sequence to probe the positive strand between the RNA operons. Since the length of any potential native transcript in the intergenic region is not known, dotted lines and double arrows indicate this potential transcript. Total RNA was extracted at 0, 15, 120, and 360 min after butyrate stress from pRD7 and pSOS95del (plasmid control). (B) After staining the membrane with methylene blue, four prominent bands are seen: 2,800 nt (23S), 2,400 nt, 1,600 nt (16S) and 700 nt. M1 and M2 are RNA markers from USB (0.1-1kb) and Ambion (0.5-9kb), respectively. (C) After probing with probe I, complementary to positions 120–147 nt of RDNA7, four prominent bands are seen in pRD7. Membrane was exposed for 48 hours. (D) After stripping probe I, complementary probe II was used to probe the same membrane. Membrane was exposed for 3 hours.
Fig. 7
Fig. 7
Northern blot analysis of 16S rRNA. Two radio-labeled oligonucleotide probes were designed for the 16S ribosomal RNA gene: one for 16-43 nt of the 16S gene (probe III) and the other for 819-919 nt of the 16S gene (probe IV) (A). Total RNA was extracted at 0, 15, 120, and 360 min after butyrate stress from pRD7 and pSOS95del (plasmid control). (B&D) After staining the membrane with methylene blue, four prominent bands are seen: 2,800 nt (23S), 2,400 nt, 1,600 nt (16S) and 700 nt. M1 and M2 are RNA markers from USB (0.1-1kb) and Ambion (0.5-9kb), respectively. (C) Visualization of the membrane in (B) probed with probe III. (E) Visualization of the membrane in (D) probed with probe IV. Both membranes were exposed for 10 min.
Fig. 8
Fig. 8
Genes upregulated following butyrate challenge. Genes shown were upregulated with 95% confidence in three of six timepoints from two biological replicate butyrate challenge experiments. Color scheme shows red for genes with higher expression in the pRD7 strain and green for lower expression in the pRD7 strain.

Similar articles

Cited by

References

    1. Alsaker KV, et al. Design, optimization and validation of genomic DNA microarraysfor examining the Clostridium acetobutylicum transcriptome. Biotechnol. BioprocessEng. 2005;10:432–443.
    1. Azcarate-Peril MA, et al. Identification and inactivation of genetic loci involved with Lactobacillus acidophilus acid tolerance. Appl. Environ. Microbiol. 2004;70:5315–22. - PMC - PubMed
    1. Ballal A, et al. The Kdp-ATPase system and its regulation. J. Biosci. 2007;32:559–68. - PubMed
    1. Borden JR, Papoutsakis ET. Dynamics of genomic-library enrichment and identification of solvent tolerance genes for Clostridium acetobutylicum. Appl. Environ. Microbiol. 2007;73:3061–8. - PMC - PubMed
    1. Bouvier M, et al. Small RNA binding to 5′ mRNA coding region inhibits translational initiation. Mol. Cell. 2008;32:827–837. - PubMed

Publication types