

Dietary fat intake promotes the development of hepatic steatosis independently from excess caloric consumption in a murine model
- PMID: 20060143
- PMCID: PMC3361716
- DOI: 10.1016/j.metabol.2009.11.006
Dietary fat intake promotes the development of hepatic steatosis independently from excess caloric consumption in a murine model
Abstract
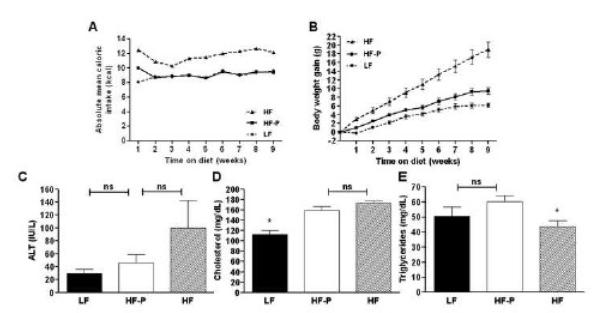
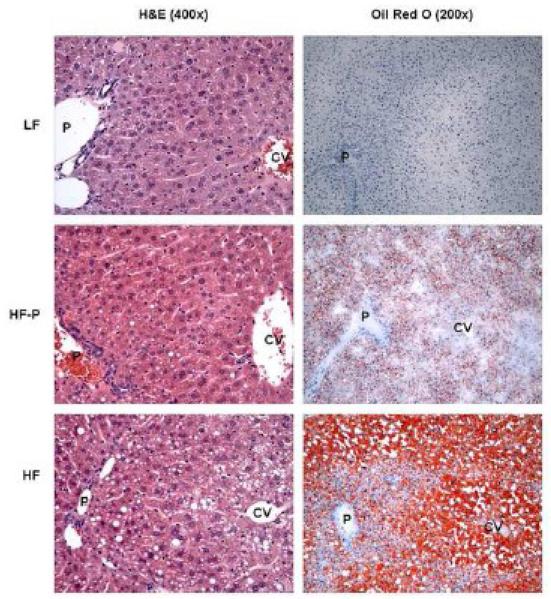
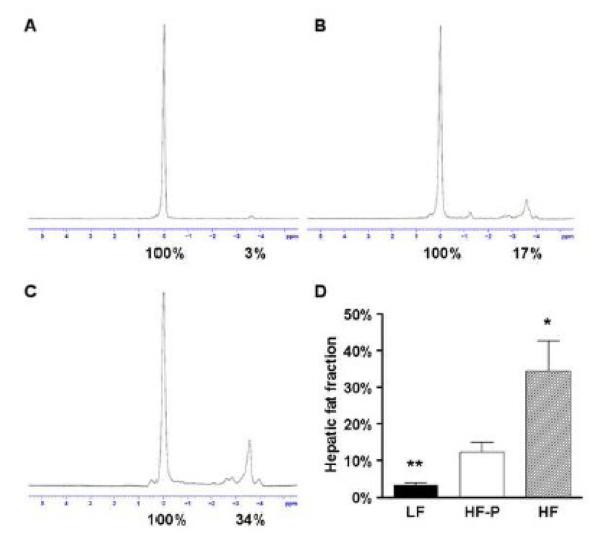
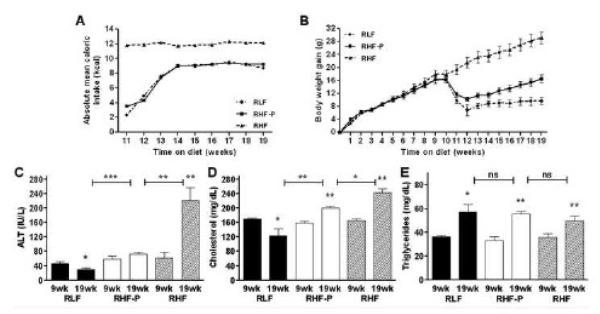
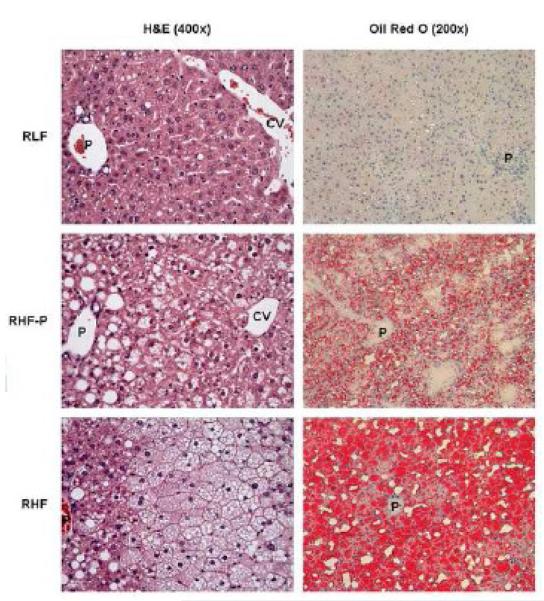
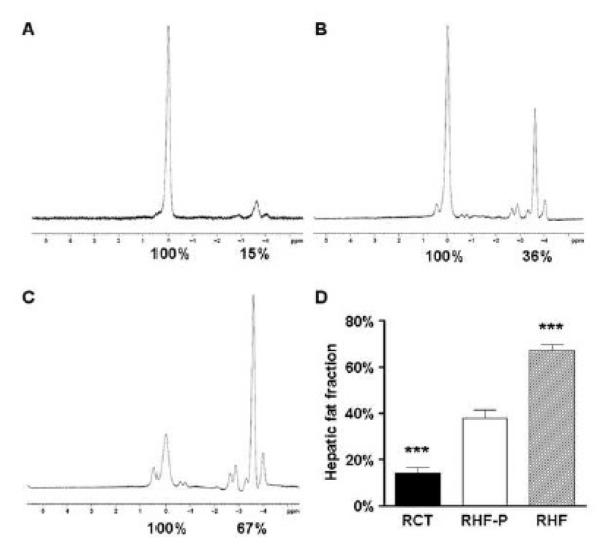
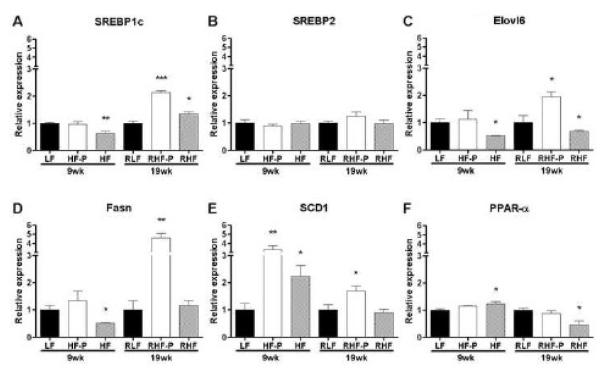
Nonalcoholic fatty liver disease results from overconsumption and is a significant and increasing cause of liver failure. The type of diet that is conducive to the development of this disease has not been established, and evidence-based treatment options are currently lacking. We hypothesized that the onset of hepatic steatosis is linked to the consumption of a diet with a high fat content, rather than related to excess caloric intake. In addition, we also hypothesized that fully manifested hepatic steatosis could be reversed by reducing the fat percentage in the diet of obese mice. C57BL/6J male mice were fed either a purified rodent diet containing 10% fat or a diet with 60% of calories derived from fat. A pair-feeding design was used to distinguish the effects of dietary fat content and caloric intake on dietary-induced hepatic lipid accumulation and associated injury. Livers were analyzed by quantitative reverse transcriptase polymerase chain reaction for lipid metabolism-related gene expression. After 9 weeks, mice on the 60%-fat diet exhibited more weight gain, insulin resistance, and hepatic steatosis compared with mice on a 10%-fat diet with equal caloric intake. Furthermore, mice with established metabolic syndrome at 9 weeks showed reversal of hepatic steatosis, insulin resistance, and obesity when switched to a 10%-fat diet for an additional 9 weeks, independent of caloric intake. Quantitative reverse transcriptase polymerase chain reaction revealed that transcripts related to both de novo lipogenesis and increased uptake of free fatty acids were significantly up-regulated in mice pair-fed a 60%-fat diet compared with 10%-fat-fed animals. Dietary fat content, independent from caloric intake, is a crucial factor in the development of hepatic steatosis, obesity, and insulin resistance in the C57BL/6J diet-induced obesity model caused by increased uptake of free fatty acids and de novo lipogenesis. In addition, once established, all these features of the metabolic syndrome can be successfully reversed after switching obese mice to a diet low in fat. Low-fat diets deserve attention in the investigation of a potential treatment of patients with nonalcoholic fatty liver disease.
Copyright 2010 Elsevier Inc. All rights reserved.
Figures
Similar articles
-
Increased dietary fat contributes to dysregulation of the LKB1/AMPK pathway and increased damage in a mouse model of early-stage ethanol-mediated steatosis.J Nutr Biochem. 2013 Aug;24(8):1436-45. doi: 10.1016/j.jnutbio.2012.12.002. Epub 2013 Mar 1. J Nutr Biochem. 2013. PMID: 23465594 Free PMC article.
-
Pollock oil supplementation modulates hyperlipidemia and ameliorates hepatic steatosis in mice fed a high-fat diet.Lipids Health Dis. 2011 Oct 25;10:189. doi: 10.1186/1476-511X-10-189. Lipids Health Dis. 2011. PMID: 22027268 Free PMC article.
-
Isocaloric manipulation of macronutrients within a high-carbohydrate/moderate-fat diet induces unique effects on hepatic lipogenesis, steatosis and liver injury.J Nutr Biochem. 2016 Mar;29:12-20. doi: 10.1016/j.jnutbio.2015.10.020. Epub 2015 Nov 17. J Nutr Biochem. 2016. PMID: 26895660 Free PMC article.
-
Nutritional modulation of nonalcoholic fatty liver disease and insulin resistance: human data.Curr Opin Clin Nutr Metab Care. 2010 Nov;13(6):709-14. doi: 10.1097/MCO.0b013e32833f4b34. Curr Opin Clin Nutr Metab Care. 2010. PMID: 20842026 Review.
-
Modulation of hepatic steatosis by dietary fatty acids.World J Gastroenterol. 2014 Feb 21;20(7):1746-55. doi: 10.3748/wjg.v20.i7.1746. World J Gastroenterol. 2014. PMID: 24587652 Free PMC article. Review.
Cited by
-
Obesity induced by a pair-fed high fat sucrose diet: methylation and expression pattern of genes related to energy homeostasis.Lipids Health Dis. 2010 Jun 9;9:60. doi: 10.1186/1476-511X-9-60. Lipids Health Dis. 2010. PMID: 20534152 Free PMC article.
-
Isocaloric Substitution of Dietary Carbohydrate Intake with Fat Intake and MRI-Determined Total Volumes of Visceral, Subcutaneous and Hepatic Fat Content in Middle-Aged Adults.Nutrients. 2019 May 23;11(5):1151. doi: 10.3390/nu11051151. Nutrients. 2019. PMID: 31126078 Free PMC article.
-
Comparative study of the modulation of fructose/sucrose-induced hepatic steatosis by mixed lipid formulations varying in unsaturated fatty acid content.Nutr Metab (Lond). 2015 Nov 14;12:41. doi: 10.1186/s12986-015-0038-x. eCollection 2015. Nutr Metab (Lond). 2015. PMID: 26583036 Free PMC article.
-
Neutral Sphingomyelinase 2 Inhibition Limits Hepatic Steatosis and Inflammation.Cells. 2024 Mar 6;13(5):463. doi: 10.3390/cells13050463. Cells. 2024. PMID: 38474427 Free PMC article.
-
High Fat Diet-Induced Changes in Hepatic Protein Abundance in Mice.J Proteomics Bioinform. 2012;5(3):60-66. doi: 10.4172/jpb.1000214. Epub 2012 Feb 29. J Proteomics Bioinform. 2012. PMID: 33907358 Free PMC article.
References
-
- Angulo P. Nonalcoholic fatty liver disease. N Engl J Med. 2002;346:1221–1231. - PubMed
-
- Powell EE, Cooksley WG, Hanson R, et al. The natural history of nonalcoholic steatohepatitis: a follow-up study of forty-two patients for up to 21 years. Hepatology. 1990;11:74–80. - PubMed
-
- Teli MR, James OF, Burt AD, et al. The natural history of nonalcoholic fatty liver: a follow-up study. Hepatology. 1995;22:1714–1719. - PubMed
-
- Browning JD, Szczepaniak LS, Dobbins R, et al. Prevalence of hepatic steatosis in an urban population in the United States: impact of ethnicity. Hepatology. 2004;40:1387–1395. - PubMed
-
- Bellentani S, Saccoccio G, Masutti F, et al. Prevalence of and risk factors for hepatic steatosis in Northern Italy. Ann Intern Med. 2000;132:112–117. - PubMed
Publication types
MeSH terms
Substances
Grants and funding
LinkOut - more resources
Full Text Sources
Other Literature Sources
Medical
