. 2010 Apr 1;686(1-2):1-8.
doi: 10.1016/j.mrfmmm.2009.11.012. Epub 2010 Jan 8.

A quantitative analysis of genomic instability in lymphoid and plasma cell neoplasms based on the PIG-A gene

Affiliations

A quantitative analysis of genomic instability in lymphoid and plasma cell neoplasms based on the PIG-A gene

David J Araten et al. Mutat Res. .

Abstract

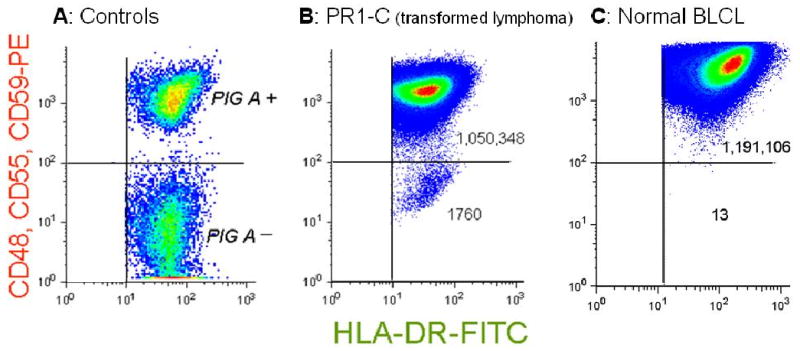
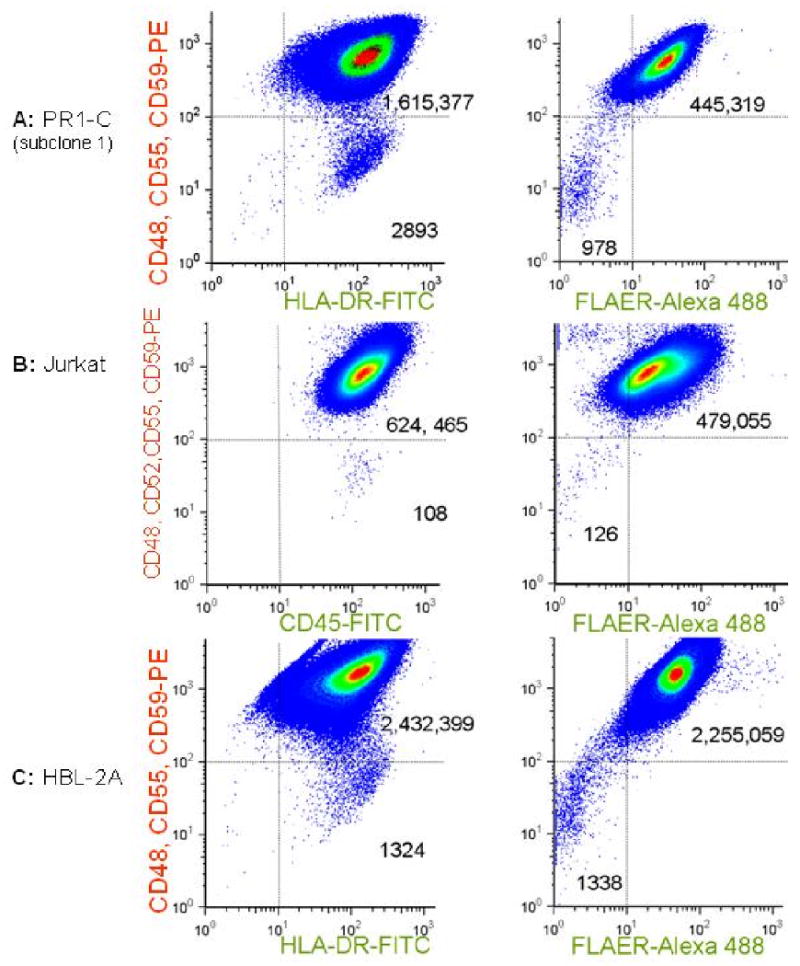
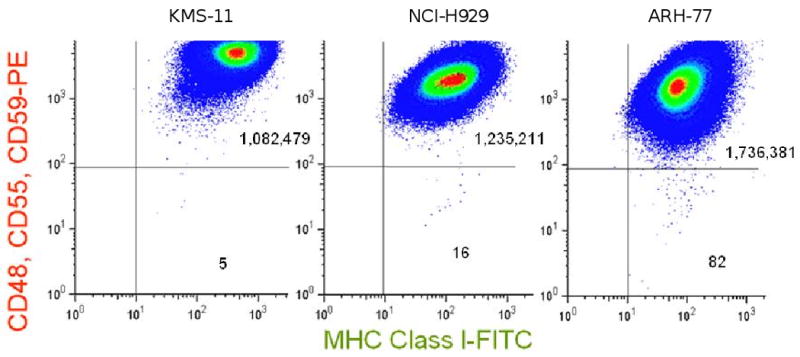
It has been proposed that hypermutability is necessary to account for the high frequency of mutations in cancer. However, historically, the mutation rate (mu) has been difficult to measure directly, and increased cell turnover or selection could provide an alternative explanation. We recently developed an assay for mu using PIG-A as a sentinel gene and estimated that its average value is 10.6 x 10(-7) mutations per cell division in B-lymphoblastoid cell lines (BLCLs) from normal donors. Here we have measured mu in human malignancies and found that it was elevated in cell lines derived from T cell acute lymphoblastic leukemia, mantle cell lymphoma, follicular lymphoma in transformed phase, and 2 plasma cell neoplasms. In contrast, mu was much lower in a marginal zone lymphoma cell line and 5 other plasma cell neoplasms. The highest mu value that we measured, 3286 x 10(-7), is 2 orders of magnitude above the range we have observed in non-malignant human cells. We conclude that the type of genomic instability detected in this assay is a common but not universal feature of hematologic malignancies.


Conflict of interest statement

There are no conflicts of interest to report.

Figures

FIGURE 1
FIGURE 1. GPI (-) populations arise spontaneously in vitro in malignant cell lines
Flow cytometry pseudo-density dot plots. (A) PIG-A (+) cells and PIG-A (-) cells within a single BLCL from a patient with PNH. The PIG-A (-) population does not express GPI-linked proteins but does express the transmembrane protein HLA-DR. (B) PR1-C, a transformed follicular lymphoma cell line, analyzed after expansion after sorting to eliminate pre-existing mutants. The normal population expresses GPI-linked proteins and transmembrane proteins, registering in the upper right quadrant. There is a large population of spontaneously arising mutants registering in the lower right quadrant that appear similar to the PIG-A (-) cells from the patient with PNH. The mutant frequency, f, is calculated as the number of events in the lower right quadrant divided by the total number events analyzed (see table). (C) A BLCL from a normal donor, demonstrating a much smaller number of spontaneously arising GPI (-) cells.
FIGURE 2
FIGURE 2. Parallel analysis of cultures of malignant cell lines using antibodies specific for transmembrane proteins or the FLAER reagent
Samples were analyzed after expansion in vitro after sorting to eliminate preexisting mutants. Pseudo-density dot plots are shown for analyses using FITC-conjugated antibodies specific for transmembrane proteins (left panels) or the FLAER Alexa-488 reagent, which binds to the GPI structure directly (right panels). In all 3 examples, there are distinct populations of spontaneously arising cells that neither express GPI-linked proteins nor take up the FLAER reagent, but which do express transmembrane proteins. (A) A subclone of PR1-C (transformed lymphoma); (B) Jurkat, a T cell ALL cell line; (C) HBL2-A, derived from a Mantle Cell Lymphoma.
Figure 3
Figure 3. Representative cell lines derived from plasma cell neoplasms
Cells were analyzed after expansion in vitro after sorting to eliminate pre-existing mutants. KMS-11 demonstrates a low number of spontaneously arising GPI (-) cells and a low mutation rate. Within NCI-H929, there is a larger population of spontaneously arising GPI (-) cells, and μ is close to the upper limit of the values we have previously reported for BLCLs from normal individuals [15,27]. In contrast, ARH-77 demonstrates a higher frequency of spontaneously arising GPI (-) cells and a higher μ value.
Figure 4
Figure 4. FISH analysis for the X and Y chromosomes
Analyses were performed on spontaneously arising GPI-negative sub-populations of Jurkat, HBL2, and PR1-C, isolated by sorting and proaerolysin selection. X and Y chromosome centromeric probes generate green and orange fluorescence respectively. Representative interphase and metaphase cells are shown. Spontaneous loss of the Y chromosome was observed, but not the spontaneous loss of the X chromosome in any of the cells analysed by FISH or G-banded karyotyping.

Similar articles

Cited by

References

    1. Albertini RJ, Nicklas JA, O'Neill JP, Robison SH. In vivo somatic mutations in humans: measurement and analysis. Ann Rev Genet. 1990;24:305–326. - PubMed
    1. Green MHL, O'Neill JP, Cole J. Suggestions concerning the relationship between mutant frequency and mutation rate at the hprt locus in human peripheral T-lymphocytes. Mutation Research. 1995;334:323–339. - PubMed
    1. Vickers MA, Hoy T, Lake H, Kyoizumi S, Boyse J, Hewitt M. Estimation of Mutation Rate at Human Glycophorin A Locus In Hematopoietic Stem Cell Progenitors. Env Mol Mut. 2002;39:333–341. - PubMed
    1. Loeb LA. Mutator phenotype may be required for multistage carcinogenesis. Cancer Res. 1991;51:3075–3079. - PubMed
    1. Hahn WC, Weinberg RA. Rules for Making Human Tumor Cells. N Engl J Med. 2002;347:1593–1603. - PubMed

Publication types

Substances