Review
. 2010 Apr-Jun;704(1-3):78-87.
doi: 10.1016/j.mrrev.2009.12.006. Epub 2010 Jan 8.

Spatiotemporal characterization of ionizing radiation induced DNA damage foci and their relation to chromatin organization

Affiliations
Review

Spatiotemporal characterization of ionizing radiation induced DNA damage foci and their relation to chromatin organization

S V Costes et al. Mutat Res. 2010 Apr-Jun.

Abstract

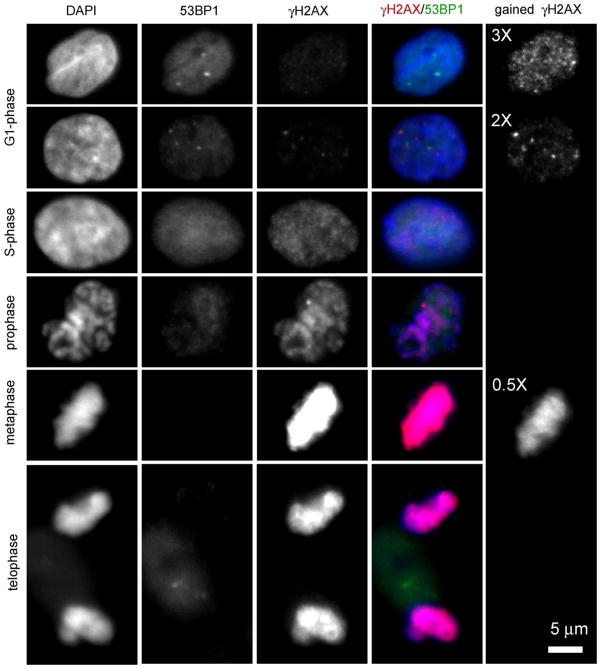
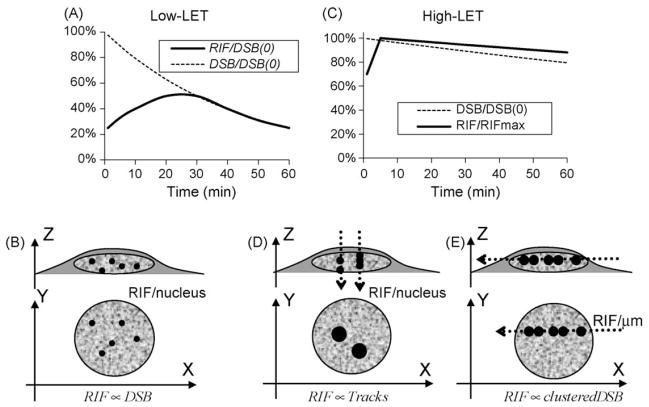
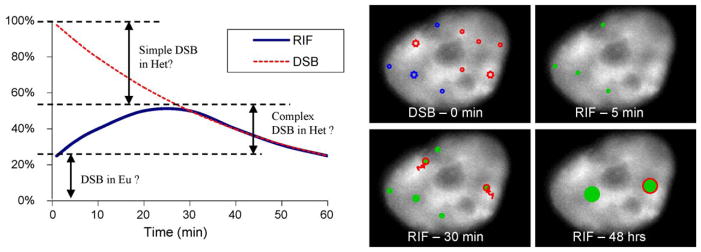
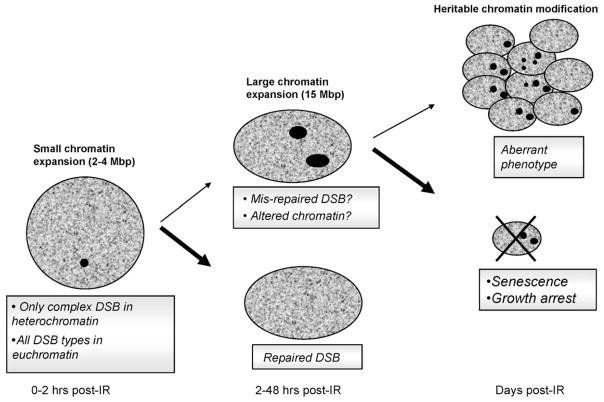
DNA damage sensing proteins have been shown to localize to the sites of DNA double strand breaks (DSB) within seconds to minutes following ionizing radiation (IR) exposure, resulting in the formation of microscopically visible nuclear domains referred to as radiation-induced foci (RIF). This review characterizes the spatiotemporal properties of RIF at physiological doses, minutes to hours following exposure to ionizing radiation, and it proposes a model describing RIF formation and resolution as a function of radiation quality and chromatin territories. Discussion is limited to RIF formed by three interrelated proteins ATM (Ataxia telangiectasia mutated), 53BP1 (p53 binding protein 1) and gammaH2AX (phosphorylated variant histone H2AX), with an emphasis on the later. This review discusses the importance of not equating RIF with DSB in all situations and shows how dose and time dependence of RIF frequency is inconsistent with a one to one equivalence. Instead, we propose that RIF mark regions of the chromatin that would serve as scaffolds rigid enough to keep broken DNA from diffusing away, but open enough to allow the repair machinery to access the damage site. We review data indicating clear kinetic and physical differences between RIF emerging from dense and uncondensed regions of the nucleus. We suggest that persistent RIF observed days following exposure to ionizing radiation are nuclear marks of permanent rearrangement of the chromatin architecture. Such chromatin alterations may not always lead to growth arrest as cells have been shown to replicate these in progeny. Thus, heritable persistent RIF spanning over tens of Mbp may reflect persistent changes in the transcriptome of a large progeny of cells. Such model opens the door to a "non-DNA-centric view" of radiation-induced phenotypes.


Figures

Fig. 1
Fig. 1
Example of typical γH2AX/53BP1 dual staining in cycling normal non-irradiated human mammary epithelial cells (MCF10A). In these images, as previously described [26], γH2AX has been fluorescently labeled in red with mouse monoclonal anti phospho-histone H2AX (Ser139) antibody (1.42 μg/ml; lot #27505; Upstate Cell Signaling Solutions Inc. Charlottesville, VA) and secondary Alexa 594 (at 1:300 from Molecular Probes, Invitrogen, Carlsbad, CA). 53BP1 has been fluorescently labeled in green with rabbit polyclonal anti 53BP1 (5 μg/ml, lot #A300-272A, Bethyl Lab, Montgomery, TX) and secondary Alexa 488 (at 1:300 from Molecular Probes, Invitrogen, Carlsbad, CA). Cells have been counter stained with DAPI which labels nuclear DNA (blue). Each channel represents one center slice of a cell acquired with the same exposure time and digital camera gain. Each row depicts a different phase of MCF10A, going from G1 (top) to mitosis (bottom). G1 cells typically show no γH2AX foci or few bright γH2AX foci. However, if the γH2AX channel gain is increased by a factor 3, the presence of many dim foci is then visible (upper right panel). In contrast, 53BP1 shows a pattern in G1 that typically matches DAPI signal, with some spontaneous foci as well. DAPI and 53BP1 pattern similarity disappears during S-phase, even though 53BP1 signal remains uniform and elevated. γH2AX immunoreactivity is significantly increased during S-phase with a pattern similar to the dim foci revealed by gained enhancement in G1. As cells move to mitosis, γH2AX immunoreactivity further increases as depicted with a fully saturated signal in metaphase that needs to be acquired with half the gain in order to not saturate the image. γH2AX pattern in mitosis matches DAPI, revealing full phosphorylation of H2AX in the condensed chromosomes. In contrast, 53BP1 seems to be progressively excluded from the nucleus during mitosis.
Fig. 2
Fig. 2
Hypothesized foci frequency curves for different radiation qualities and exposure regimens. Upper panels (A and C) depict relative RIF frequencies expected with each radiation quality compared to the expected relative DSB kinetics as measured by PFGE; lower panels (B, D and E) depict geometrical configuration of cells grown as monolayer during irradiation, with dotted lines representing direction of high-LET beam across cells (D and E); the XY plane depicts the way RIF will be visualized microscopically, with representative RIF sizes. (A and B) Schematize the low-LET RIF kinetics, where geometrical configuration has no effect. Both percentages of RIF (solid line) and DSB (dotted line) per nucleus with respect to the initial expected number of DSB (DSB(0)) are graphed with the curves reflecting the lack of foci detection for DSB repaired within the first 30 min. Kinetic curves are based on the assumption of a 30 min half-life for DSB repair after low-LET and show good correlation with DSB kinetic after 30 min (symbolized by RIF ∝ DSB). (C) Schematizes the relative RIF frequency normalized to its maximum value following high-LET exposure. Normalizing to the expected number of DSB is not done here as RIF for high-LET reflects more DSB clustering. High-LET typically induces slower DSB repair and is approximated here with a 2.5 h half-life for a LET ~150 keV/μm [38,39]. In contrast, high-LET RIF have been shown to have an even slower resolution half-life of 5 h [26]. Two possible geometries can be applied for high-LET, with a beam perpendicular to the plate (D), leading to multiple DSB in a single focus per track when visualizing foci or with beam parallel to the plate (E). In the perpendicular configuration, foci frequencies correlate with track traversal (symbolized by RIF ∝ tracks), not DSB. The horizontal configuration (E) leads to visual track with multiple larger foci along it. Such geometry permits evaluation of the number of RIF/μm along the track instead of the classic RIF/nucleus. The slower kinetic for high-LET reflects repair of complex damages as well as clustering of these damages into single foci. One must note here that high energy particles (HZE) are more favorable for such a geometrical configuration, since particles must go through mm to cm of media and plastic. As has been previously described, for lower particle energies, one has to angle slides in such a manner as to allow the beam to hit the bottom of the slide to avoid traversal through large amounts of medium [40,75].
Fig. 3
Fig. 3
Hypothetical contribution of simple and complex DSB for the classic low-LET RIF kinetic. The left panel repeats the low-LET kinetic curves shown in Fig. 2A with an interpretation of the different types of DSB contributing to the RIF kinetics. The majority of DSB are immediately detected by RIF in the euchromatin (abbreviated Eu) whereas only complex DSB in heterochromatin (abbreviated Het) are detected by RIF and their detection is delayed due to the time it takes to move a DSB to the interface next to euchromatin DNA. The right panel illustrates the kinetic by showing a human cell stained for DAPI with hypothetical regions of DNA damage following IR. Simple DSB are noted as circles and complex DSBs as larger stars. At 0 min, initial damages are shown with blue DSB in low DAPI regions (euchromatin) and red DSB in bright DAPI regions (heterochromatin). At 5 min, only DSB in euchromatin have led to RIF (green full circles), where as complex DSBs in the heterochromatin need to move towards DAPI dim regions as noted by red arrows before being detected at 30 min (shown as green full circles with red edges to note their origin from the heterochromatin). Permanent DNA or chromatin changes are marked by larger RIF sizes at 48 h and are more likely to occur from complex DSB as depicted here.
Fig. 4
Fig. 4
RIF formation/resolution and cell fate. Boxed legends indicate what type of damages foci mark. Bold text indicates corresponding chromatin status for each of these foci types. Small arrows in the flow chart indicate lower probability of events to take place based on discussion in the text. For example, cells with persistent RIF related to unrepaired DNA will most likely be eliminated (large arrow, cross). On the other hand, when a RIF marks chromatin changes where DNA damage was repaired successfully, there should be no obstacles for a cell to resume division (small arrow) allowing replication of its aberrant chromatin.

Similar articles

Cited by

References

    1. Haaf T, Golub EI, Reddy G, Radding CM, Ward DC. Nuclear foci of mammalian Rad51 recombination protein in somatic cells after DNA damage and its localization in synaptonemal complexes. Proc Natl Acad Sci USA. 1995;92:2298–2302. - PMC - PubMed
    1. Ashley T, Plug AW, Xu J, Solari AJ, Reddy G, Golub EI, Ward DC. Dynamic changes in Rad51 distribution on chromatin during meiosis in male and female vertebrates. Chromosoma. 1995;104:19–28. - PubMed
    1. Schultz LB, Chehab NH, Malikzay A, Halazonetis TD. p53 Binding protein 1 (53BP1) is an early participant in the cellular response to DNA double-strand breaks. J Cell Biol. 2000;151:1381–1390. - PMC - PubMed
    1. Maser RS, Monsen KJ, Nelms BE, Petrini JH. hMre11 and hRad50 nuclear foci are induced during the normal cellular response to DNA double-strand breaks. Mol Cell Biol. 1997;17:6087–6096. - PMC - PubMed
    1. Nelms BE, Maser RS, MacKay JF, Lagally MG, Petrini JH. In situ visualization of DNA double-strand break repair in human fibroblasts. Science. 1998;280:590–592. - PubMed

Publication types

MeSH terms