

Hunger and thirst: issues in measurement and prediction of eating and drinking
- PMID: 20060847
- PMCID: PMC2849909
- DOI: 10.1016/j.physbeh.2009.12.026
Hunger and thirst: issues in measurement and prediction of eating and drinking
Abstract
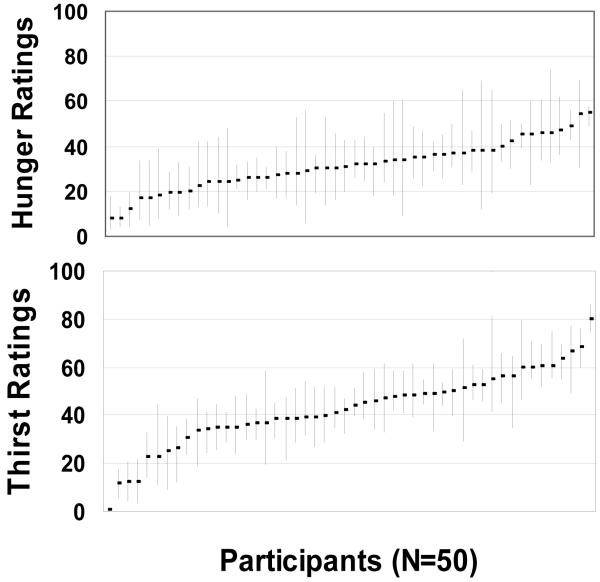
Associations between hunger and eating and between thirst and drinking are generally weak. This stems, in part, from limitations in the measurement of these sensations which generally rely on temporal, motivational, metabolic and/or self-reported descriptive indices. Each is critically reviewed. Also problematic is the fact that the deterministic depletion-repletion concept of ingestive behavior fails to account for influences of a multitude of contravening cognitive, social, sensory and logistical factors. Although hunger and thirst serve some parallel purposes, sharp distinctions are also present with health implications. Of particular note are the observations that thirst ratings are higher and more stable over the day compared to hunger and thirst may be more motivating to drink than hunger is to eat. Coupling these observations with evidence that beverages have limited satiety value, they pose particular challenges and opportunities. Beverages can facilitate the delivery of nutrients to those desiring or requiring them, but also to those where they are not desired or required. The benefits and risks are a function of their use rather than their inherent properties.
Copyright 2010 Elsevier Inc. All rights reserved.
Figures


Similar articles
-
Thirst-drinking, hunger-eating; tight coupling?J Am Diet Assoc. 2009 Mar;109(3):486-90. doi: 10.1016/j.jada.2008.11.027. J Am Diet Assoc. 2009. PMID: 19248867 Free PMC article.
-
Relationships between human thirst, hunger, drinking, and feeding.Physiol Behav. 2008 Aug 6;94(5):700-8. doi: 10.1016/j.physbeh.2008.04.007. Epub 2008 Apr 13. Physiol Behav. 2008. PMID: 18499200 Free PMC article. Review.
-
Mode of consumption plays a role in alleviating hunger and thirst.Obesity (Silver Spring). 2012 Mar;20(3):517-24. doi: 10.1038/oby.2011.345. Epub 2011 Nov 17. Obesity (Silver Spring). 2012. PMID: 22095116
-
Hunger and thirst interact to regulate ingestive behavior in flies and mammals.Bioessays. 2017 May;39(5). doi: 10.1002/bies.201600261. Epub 2017 Mar 20. Bioessays. 2017. PMID: 28319257 Review.
-
Thirst, Hunger, and Nephrogenic Diabetes Insipidus.N Engl J Med. 2024 May 30;390(20):1922-1924. doi: 10.1056/NEJMcibr2400066. N Engl J Med. 2024. PMID: 38810192 No abstract available.
Cited by
-
The predictive value of hunger score on gastric evacuation after oral intake of carbohydrate solution.BMC Anesthesiol. 2018 Jan 12;18(1):6. doi: 10.1186/s12871-018-0470-3. BMC Anesthesiol. 2018. PMID: 29329510 Free PMC article.
-
Primary polydipsia: Update.Best Pract Res Clin Endocrinol Metab. 2020 Sep;34(5):101469. doi: 10.1016/j.beem.2020.101469. Epub 2020 Oct 14. Best Pract Res Clin Endocrinol Metab. 2020. PMID: 33222764 Free PMC article. Review.
-
Sugar-sweetened beverages, effects on appetite and public health strategies to reduce the consumption among children: a review.Porto Biomed J. 2022 Feb 8;7(1):e172. doi: 10.1097/j.pbj.0000000000000172. eCollection 2022 Mar-Apr. Porto Biomed J. 2022. PMID: 35146179 Free PMC article. Review.
-
Valuing the Diversity of Research Methods to Advance Nutrition Science.Adv Nutr. 2022 Aug 1;13(4):1324-1393. doi: 10.1093/advances/nmac043. Adv Nutr. 2022. PMID: 35802522 Free PMC article.
-
On the Abilities of Unconscious Freudian Motivational Drives to Evoke Conscious Emotions.Front Psychol. 2019 Mar 7;10:470. doi: 10.3389/fpsyg.2019.00470. eCollection 2019. Front Psychol. 2019. PMID: 30899234 Free PMC article.
References
-
- Meier JJ, Nauck MA, Pott A, et al. Glucagon-like peptide 2 stimulates glucagon secretion, enhances lipid absorption, and inhibits gastric acid secretion in humans. Gastroenterology. 2006;130:44–54. - PubMed
-
- Popkin BM, Nielsen SJ. The sweetening of the world’s diet. Obes Res. 2003;11:1325–32. - PubMed
-
- Shirreffs SM, Merson SJ, Fraser SM, Archer DT. The effects of fluid restriction on hydration status and subjective feelings in man. Br J Nutr. 2004;91:951–8. - PubMed
-
- Yeomans MR, Hails NJ, Nesic JS. Alcohol and the appetizer effect. Behav Pharmacol. 1999;10:151–61. - PubMed
Publication types
MeSH terms
Grants and funding
LinkOut - more resources
Full Text Sources
Other Literature Sources
