. 2010 Mar 15;48(6):821-30.
doi: 10.1016/j.freeradbiomed.2009.12.024. Epub 2010 Jan 11.

Mitochondrial superoxide dismutase SOD2, but not cytosolic SOD1, plays a critical role in protection against glutamate-induced oxidative stress and cell death in HT22 neuronal cells

Affiliations

Mitochondrial superoxide dismutase SOD2, but not cytosolic SOD1, plays a critical role in protection against glutamate-induced oxidative stress and cell death in HT22 neuronal cells

Masayuki Fukui et al. Free Radic Biol Med. .

Abstract

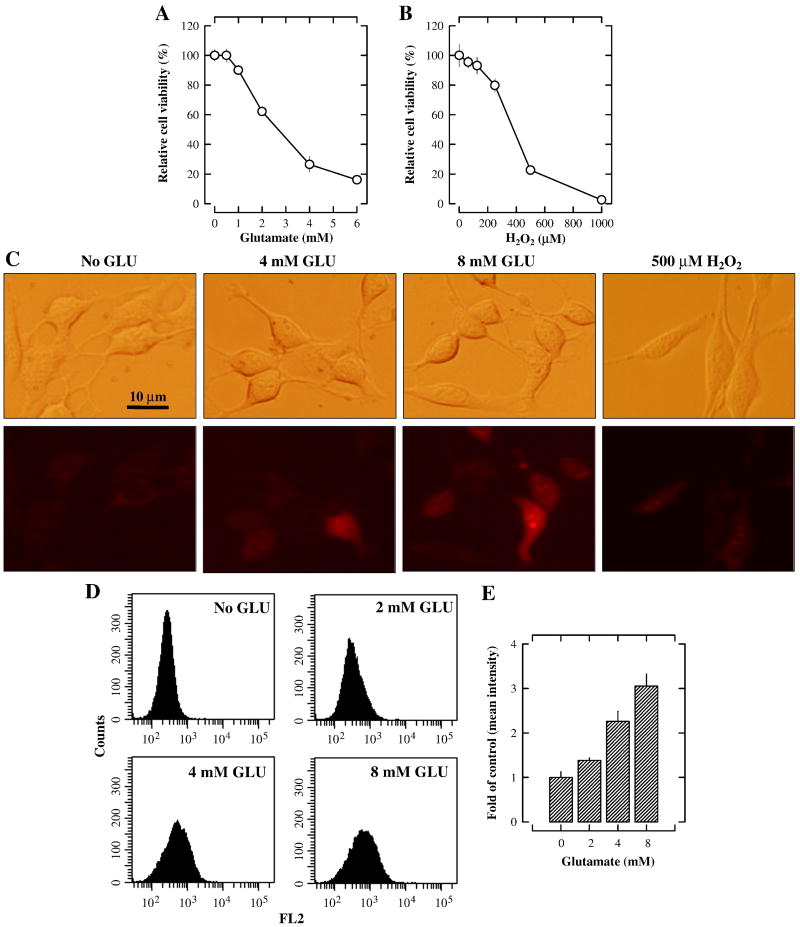
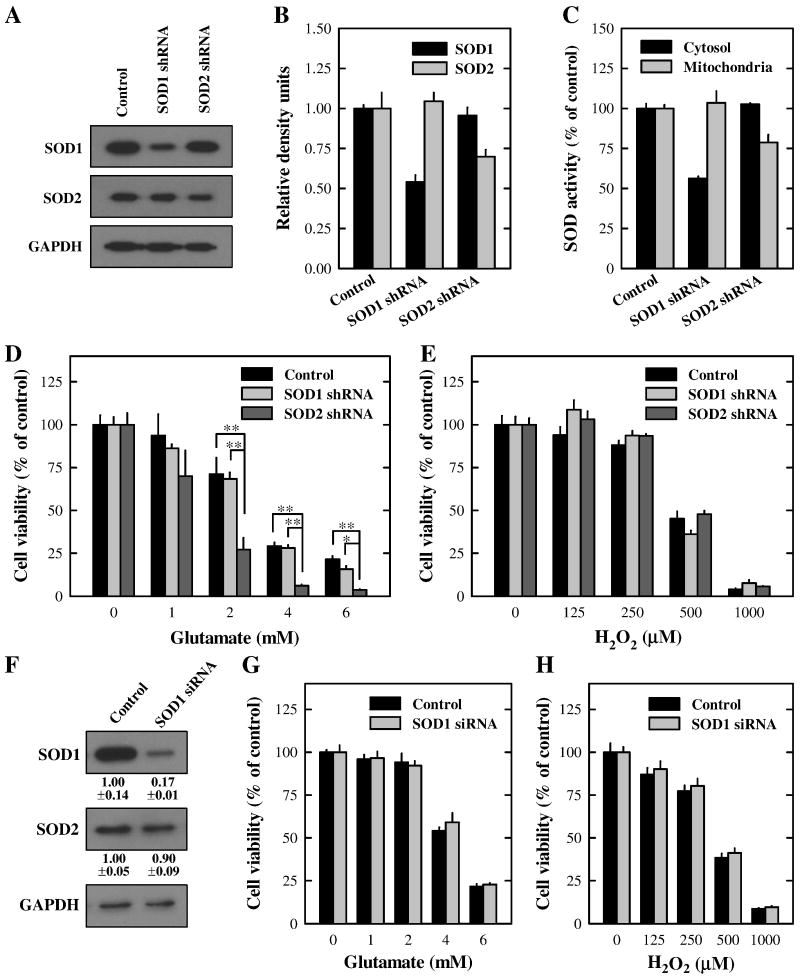
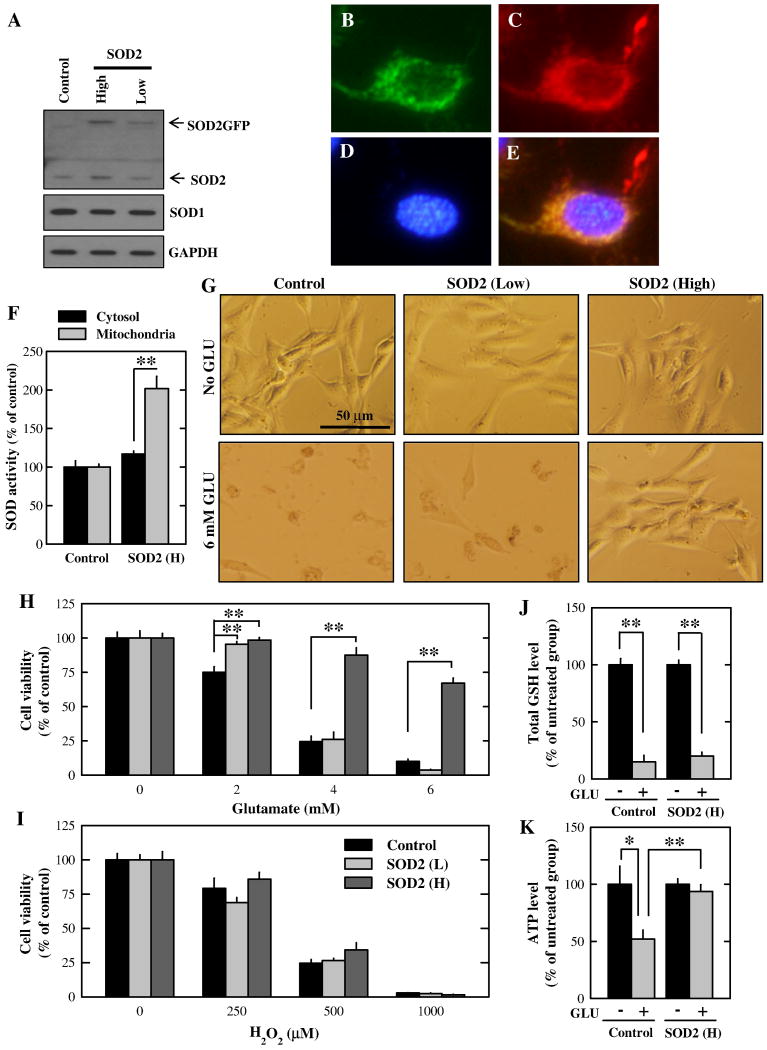
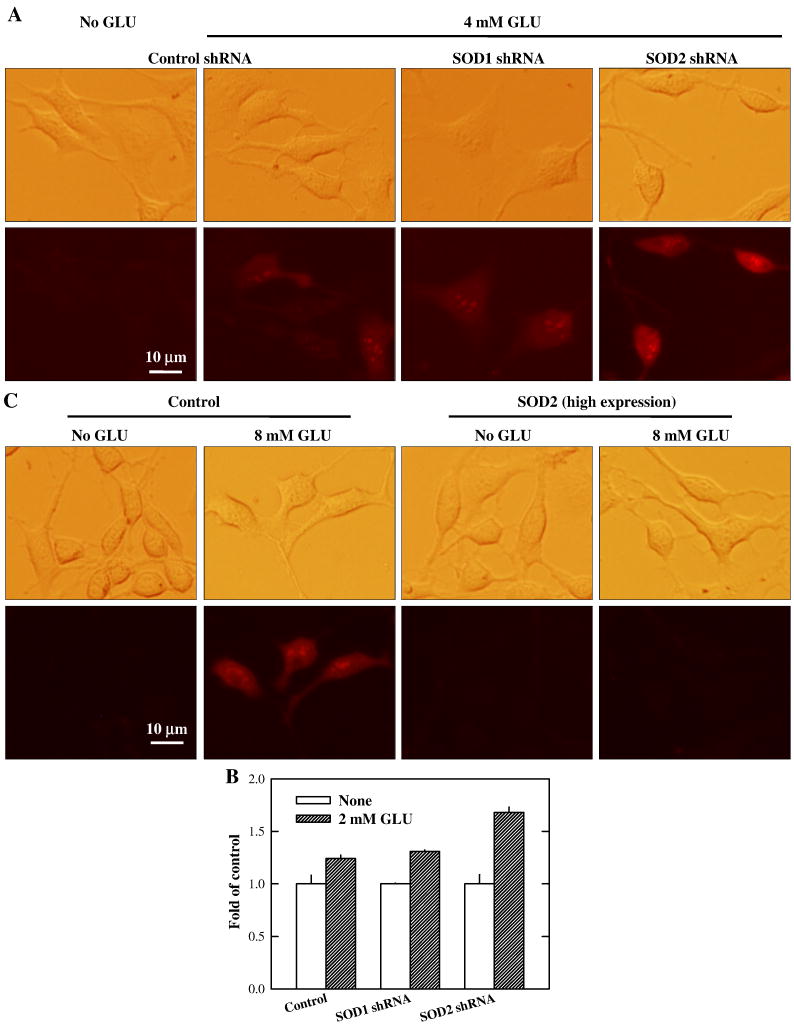
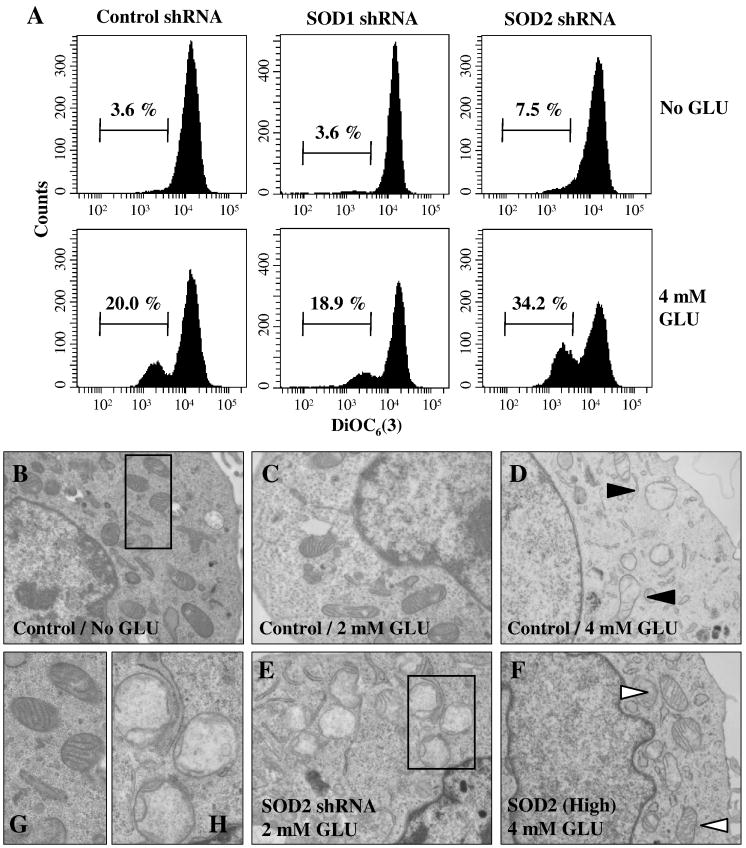
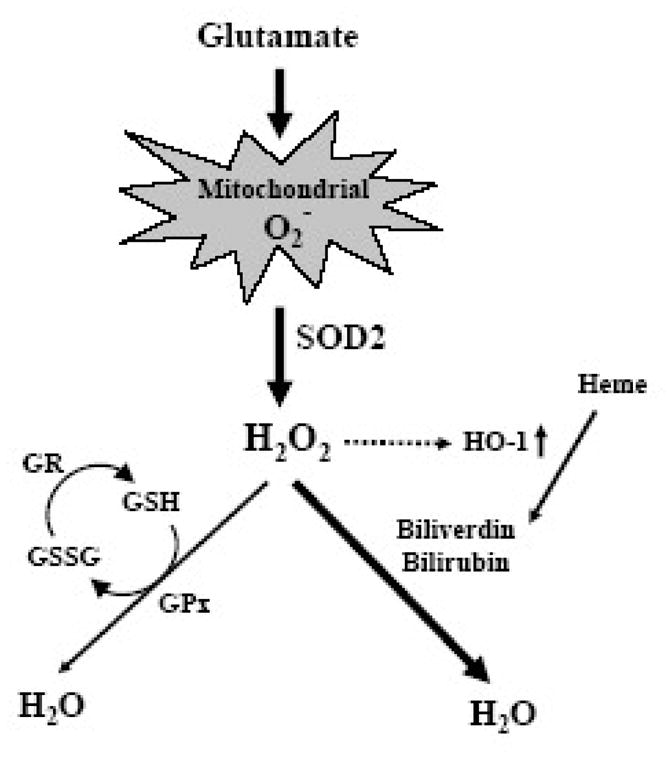
Oxidative cell death is an important contributing factor in neurodegenerative diseases. Using HT22 mouse hippocampal neuronal cells as a model, we sought to demonstrate that mitochondria are crucial early targets of glutamate-induced oxidative cell death. We show that when HT22 cells were transfected with shRNA for knockdown of the mitochondrial superoxide dismutase (SOD2), these cells became more susceptible to glutamate-induced oxidative cell death. The increased susceptibility was accompanied by increased accumulation of mitochondrial superoxide and loss of normal mitochondrial morphology and function at early time points after glutamate exposure. However, overexpression of SOD2 in these cells reduced the mitochondrial superoxide level, protected mitochondrial morphology and functions, and provided resistance against glutamate-induced oxidative cytotoxicity. The change in the sensitivity of these SOD2-altered HT22 cells was neurotoxicant-specific, because the cytotoxicity of hydrogen peroxide was not altered in these cells. In addition, selective knockdown of the cytosolic SOD1 in cultured HT22 cells did not appreciably alter their susceptibility to either glutamate or hydrogen peroxide. These findings show that the mitochondrial SOD2 plays a critical role in protecting neuronal cells from glutamate-induced oxidative stress and cytotoxicity. These data also indicate that mitochondria are important early targets of glutamate-induced oxidative neurotoxicity.


Figures

Figure 1
Figure 1. Induction of neuronal cell death in cultured HT22 cells by glutamate and hydrogen peroxide
A and B. HT22 cells were treated with glutamate or hydrogen peroxide, respectively, at indicated concentrations for 24 h, and the cell viability was determined using the MTT assay. N = 5 for each group. Vertical error bars indicate standard deviation (S.D.). The experiment was repeated more than three times, and similar results were observed. A representative data set is shown. C. HT22 cells were treated with 4 or 8 mM glutamate for 8 h or with 500 μM hydrogen peroxide for 3 h. Cells were then stained with 5 μM MitoSOX Red (a mitochondrial superoxide indicator), and visualized using a fluorescence microscope. D and E. Quantitative data of the mitochondrial superoxide levels in glutamate-treated HT22 cells. Analysis was done by a flow cytometer.
Figure 2
Figure 2. Effect of SOD1 or SOD2 knockdown on the death of HT22 cells induced by glutamate or hydrogen peroxide
A. HT22 cells were stably transfected with the SOD1 or SOD2 shRNA plasmid or with a scrambled non-targeting shRNA plasmid as described in Materials and Methods. Cell extracts were prepared and subjected to Western blotting of SOD1 and SOD2. Membranes were stripped and re-probed for GAPDH as a loading control. Shown are results from a representative experiment. B. Protein level was quantified using the Scion image software (Scion Corporation, Frederick, MD) and normalized as the ratio to GAPDH. C. Mitochondrial and cytosolic fractions were isolated from control cells as well as SOD1- and SOD2-knock down cells. The SOD enzymatic activity in each fraction was measured and normalized as a ratio relative to the control activity. D and E. Control and SOD-knockdown cells were treated with glutamate (D) or hydrogen peroxide (E), respectively, at indicated concentrations for 24 h. F. HT22 cells were transfected with the SOD1 siRNA or with a scrambled non-targeting siRNA as described in Materials and Methods. Cell extracts were prepared and subjected to Western blotting of SOD1 and SOD2. Membranes were stripped and re-probed for GAPDH as a loading control. Protein levels were quantified and normalized as the ratio to GAPDH. G and H. HT22 cells were transfected with scrambled siRNA or SOD1 siRNA. Forty-eight h later, cells were treated with glutamate (G) or hydrogen peroxide (H), respectively, at indicated concentrations for 24 h. Cell viability was determined using the MTT assay. Vertical error bars indicate standard deviation (S.D.), with N = 5 for each treatment group. The experiment was repeated over three times, and similar observations were made (a representative data set is shown). * P < 0.01, **P < 0.001.
Figure 3
Figure 3. Effect of SOD2 overexpression on glutamate- and hydrogen peroxide-induced cell death in HT22 cells
A. Western blot analysis of extracts from cells transfected with the control vector or SOD2 expression vector. B–E. Cells with high SOD2 expression were stained with 500 nM MitoTracker Red and 500 nM Hoechst33342 for 20 min. Cells were visualized using a fluorescence microscope (B. SOD2GFP. C. MitoTracker Red. D. Hoechst33342. E. Merged image of three colors). F. Mitochondrial and cytosolic fractions were isolated from control cells and cells with high SOD2 expression. SOD enzymatic activity in each fraction was measured and normalized as the ratio to the control cells. G. Morphological changes of cells with low or high SOD2 expression following treatment with 6 mM glutamate for 24 h. H and I. Cells with low or high SOD2 expression were treated with glutamate (H) or hydrogen peroxide (I) at indicated concentrations for 24 h. Cell viability was determined using the MTT assay. J. Control cells and cells with high SOD2 expression were treated with 4 mM glutamate for 8 h. Total GSH levels were measured and normalized as the ratio to the non-treated cells. K. Control cells and cells with high SOD2 expression were treated with 4 mM glutamate for 8 h. ATP levels were measured and normalized as the ratio to the non-treated cells. Vertical error bars indicate standard deviation (S.D.), with N = 5 for each treatment group. The experiment was repeated over three times, and similar observations were made (a representative data set is shown). * P < 0.05, **P < 0.01.
Figure 4
Figure 4. Effect of SOD expression levels on mitochondrial superoxide generation
(A) HT22 cells with stable knockdown of SOD1 or SOD2 were treated with 4 mM glautamate for 8 h, and then stained with MitoSOX Red. Mitochondrial superoxide generation was visualized using a fluorescence microscope. (B) HT22 cells with stable knockdown of SOD1 or SOD2 were treated with 2 mM glautamate for 8 h, and then stained with MitoSOX Red. Quantitative analysis of mitochondrial superoxide was carried out using a flow cytometer. (C) HT22 cells with SOD2 high-expression were treated with 8 mM glutamate for 8 h, and then stained with MitoSOX Red. Mitochondrial superoxide generation was visualized using a fluorescence microscope. The experiment was repeated three times, and similar results were obtained (a representative data set was shown). Vertical error bars indicate standard deviation (S.D.), with N = 3 for each treatment group.
Figure 5
Figure 5. Effect of SOD1 or SOD2 knockdown on glutamate-induced mitochondrial dysfunction in HT22 cells
A. Cells stably transfected with the SOD1 or SOD2 shRNA plasmid were treated with 4 mM glutamate. After 12-h incubation, cells were stained with DiOC6(3) and then mitochondrial membrane potential (MMP) was determined using a flow cytometer. Shown are results from a representative experiment. B–H. HT22 cells were treated with glutamate at indicated concentrations for 12 h before examination by transmission electron microscopy. B, C, and D. TEM images for the control shRNA plasmid-transfected HT22 cells. E. TEM image for SOD2-knockdown HT22 cells. F. TEM for SOD2 high expression cells. G and H. Enlarged TEM images of the intracellular organelles in the regions outlined with a box in panels B and E, respectively
Figure 6
Figure 6. A putative scheme depicting the mitochondrial superoxide detoxification pathways in SOD2-overexpressing HT22 neuronal cells
SOD2, but not SOD1, mediates the conversion of the highly cytotoxic mitochondrial superoxide (O2) to hydrogen peroxide (H2O2). Hydrogen peroxide can be further detoxified by different pathways. Because the total glutathione (GSH) level is markedly reduced following glutamate treatment, it is likely that the glutathione peroxidase (GPx) pathway may not contribute importantly as usual to the conversion of hydrogen peroxide to water. In comparison, the mitochondrial HO-1 pathway is expected to play a more important role in detoxifying hydrogen peroxide. HO-1 inactivates hydrogen peroxide indirectly via the formation of biliverdin and bilirubin, both of which can serve as effective ROS scavengers. Notably, an earlier study [37] reported that HO-1 is inducible following exposure to hydrogen peroxide, thus suggesting that the HO1 pathway may play a critical role in the protection against glutamate-induced neuronal damage. The abbreviations used: GSSG, oxidized form of glutathione; GR, glutathione reductase.

Similar articles

Cited by

References

    1. Coyle JT, Puttfarcken P. Oxidative stress, glutamate, and neurodegenerative disorders. Science. 1993;262:689–695. - PubMed
    1. Blandini F, Porter RH, Greenamyre JT. Glutamate and Parkinson’s desease. Mol Neurobiol. 1996;12:73–94. - PubMed
    1. Choi DW. Glutamate neurotoxicity and diseases of nervous system. Neuron. 1988;1:623–634. - PubMed
    1. Choi DW. Exitotoxic cell death. J Neurobiol. 1992;23:1261–1276. - PubMed
    1. Tan S, Wood M, Maher P. Oxidative stress induces a form of programmed cell death with characteristics of both apoptosis and necrosis in neuronal cells. J Neurochem. 1998;71:95–105. - PubMed

Publication types

LinkOut - more resources