

Brain composition and olfactory learning in honey bees
- PMID: 20060918
- PMCID: PMC4451457
- DOI: 10.1016/j.nlm.2010.01.001
Brain composition and olfactory learning in honey bees
Abstract
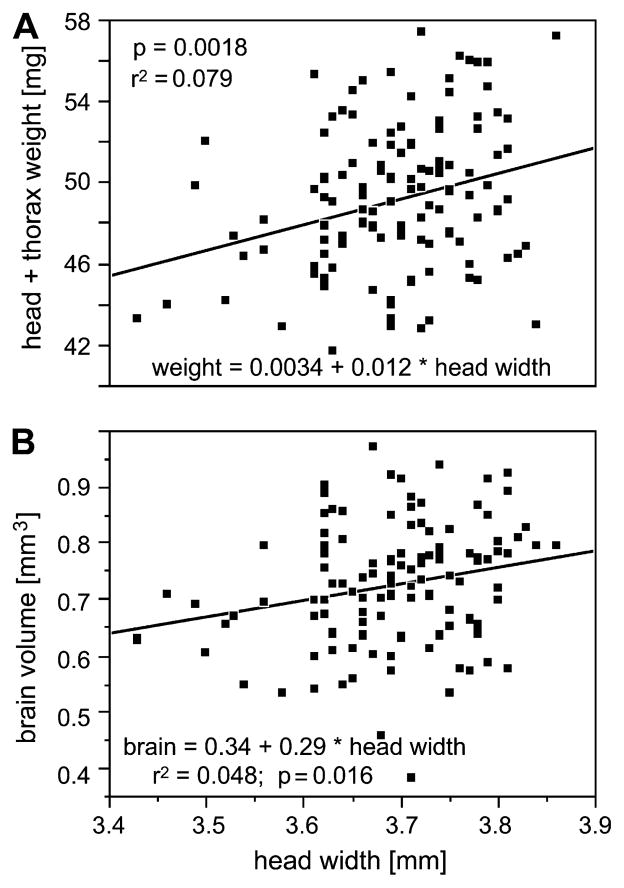
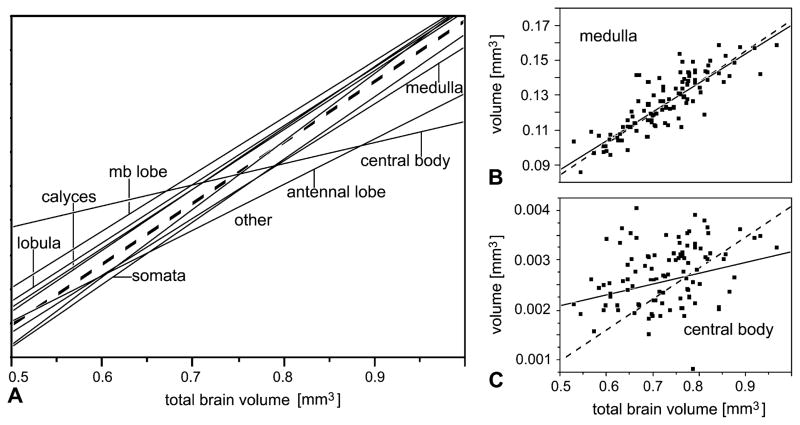
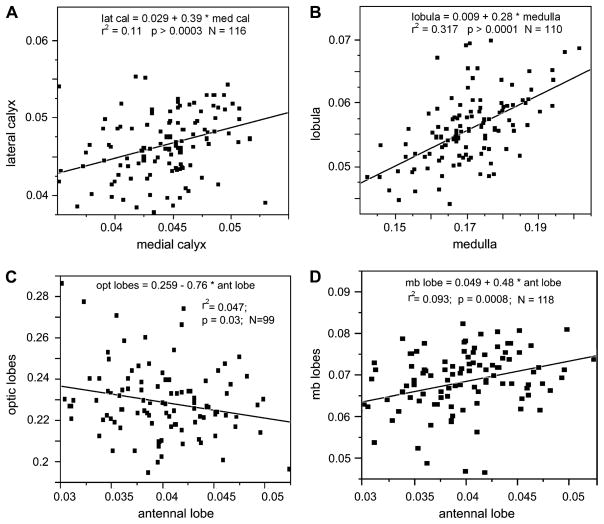
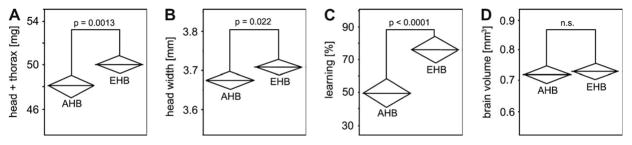
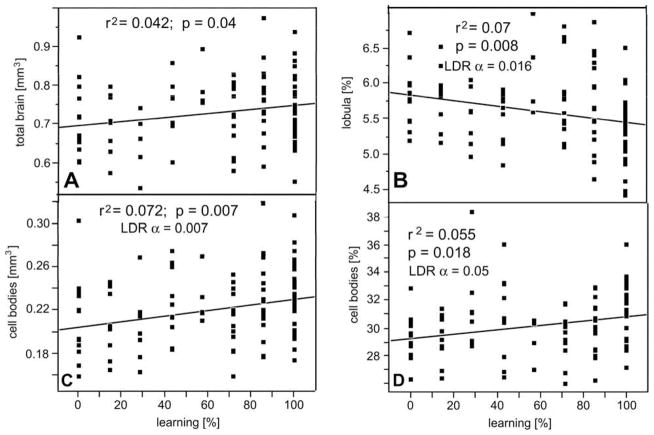
Correlations between brain or brain component size and behavioral measures are frequently studied by comparing different animal species, which sometimes introduces variables that complicate interpretation in terms of brain function. Here, we have analyzed the brain composition of honey bees (Apis mellifera) that have been individually tested in an olfactory learning paradigm. We found that the total brain size correlated with the bees' learning performance. Among different brain components, only the mushroom body, a structure known to be involved in learning and memory, showed a positive correlation with learning performance. In contrast, visual neuropils were relatively smaller in bees that performed better in the olfactory learning task, suggesting modality-specific behavioral specialization of individual bees. This idea is also supported by inter-individual differences in brain composition. Some slight yet statistically significant differences in the brain composition of European and Africanized honey bees are reported. Larger bees had larger brains, and by comparing brains of different sizes, we report isometric correlations for all brain components except for a small structure, the central body.
2010 Elsevier Inc. All rights reserved.
Figures
Similar articles
-
Differential Brain Expression Patterns of microRNAs Related to Olfactory Performance in Honey Bees (Apis mellifera).Genes (Basel). 2023 Apr 28;14(5):1000. doi: 10.3390/genes14051000. Genes (Basel). 2023. PMID: 37239360 Free PMC article.
-
Experience-dependent tuning of early olfactory processing in the adult honey bee, Apis mellifera.J Exp Biol. 2020 Jan 6;223(Pt 1):jeb206748. doi: 10.1242/jeb.206748. J Exp Biol. 2020. PMID: 31767739 Free PMC article.
-
The effects of age on olfactory learning and memory in the honey bee Apis mellifera.Neuroreport. 1997 Feb 10;8(3):789-93. doi: 10.1097/00001756-199702100-00042. Neuroreport. 1997. PMID: 9106768
-
Behavioral studies of learning in the Africanized honey bee (Apis mellifera L.).Brain Behav Evol. 2002;59(1-2):68-86. doi: 10.1159/000063734. Brain Behav Evol. 2002. PMID: 12097861 Review.
-
[Olfactory perception and learning in the honey bee (Apis mellifera): calcium imaging in the antenna lobe].J Soc Biol. 2003;197(3):277-82. J Soc Biol. 2003. PMID: 14708349 Review. French.
Cited by
-
Evolutionary ecology of intraspecific brain size variation: a review.Ecol Evol. 2013 Aug;3(8):2751-64. doi: 10.1002/ece3.627. Epub 2013 Jun 26. Ecol Evol. 2013. PMID: 24567837 Free PMC article.
-
Comparison of Navigation-Related Brain Regions in Migratory versus Non-Migratory Noctuid Moths.Front Behav Neurosci. 2017 Sep 4;11:158. doi: 10.3389/fnbeh.2017.00158. eCollection 2017. Front Behav Neurosci. 2017. PMID: 28928641 Free PMC article.
-
No gains for bigger brains: Functional and neuroanatomical consequences of relative brain size in a parasitic wasp.J Evol Biol. 2019 Jul;32(7):694-705. doi: 10.1111/jeb.13450. Epub 2019 Apr 13. J Evol Biol. 2019. PMID: 30929291 Free PMC article.
-
Investment in higher order central processing regions is not constrained by brain size in social insects.Proc Biol Sci. 2014 Apr 16;281(1784):20140217. doi: 10.1098/rspb.2014.0217. Print 2014 Jun 7. Proc Biol Sci. 2014. PMID: 24741016 Free PMC article.
-
Differential investment in visual and olfactory brain areas reflects behavioural choices in hawk moths.Sci Rep. 2016 May 17;6:26041. doi: 10.1038/srep26041. Sci Rep. 2016. PMID: 27185464 Free PMC article.
References
-
- Aboitiz F. Does bigger mean better? Evolutionary determinants of brain size and structure. Brain Behavior and Evolution. 1996;47:225–245. - PubMed
-
- Benjamini Y, Hochberg Y. Controlling the false discovery rate: A practical and powerful approach to multiple testing. Journal of the Royal Statistical Society B. 1995;57:289–300.
-
- Bitterman M, Menzel R, Fietz A, Schäfer S. Classical conditioning of proboscis extension in honeybees (Apis mellifera) Journal of Comparative Psychology. 1983;97:107–119. - PubMed
-
- Brainard MS, Doupe AJ. What songbirds teach us about learning. Nature. 2002;417:351–358. - PubMed
-
- Catania KC, Kaas JH. Organization of the somatosensory cortex of the star-nosed mole. Journal of Comparative Neurology. 1995;351:549–567. - PubMed
Publication types
MeSH terms
Grants and funding
LinkOut - more resources
Full Text Sources
