

Assessment of cardiac iron by MRI susceptometry and R2* in patients with thalassemia
- PMID: 20061110
- PMCID: PMC2839041
- DOI: 10.1016/j.mri.2009.12.001
Assessment of cardiac iron by MRI susceptometry and R2* in patients with thalassemia
Abstract
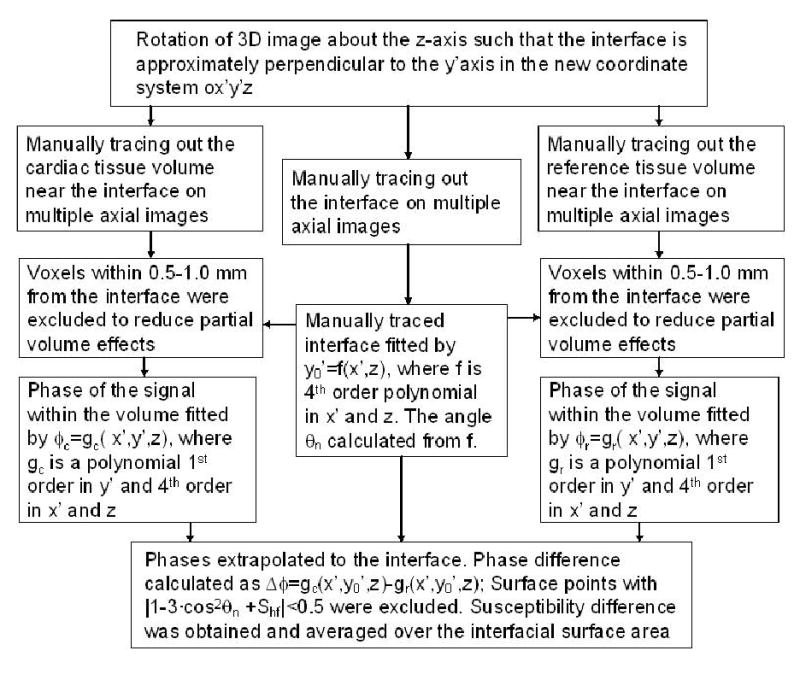
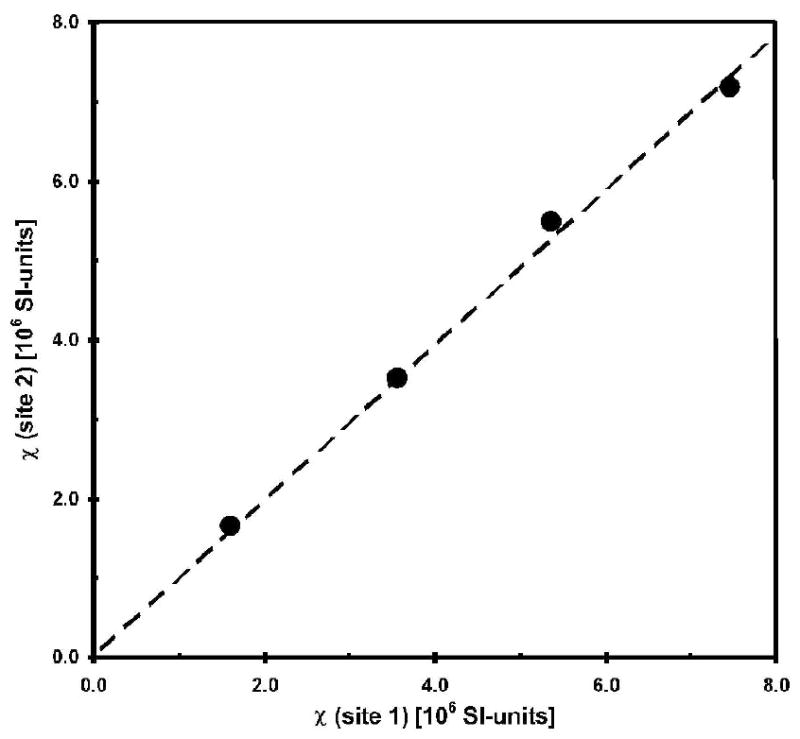
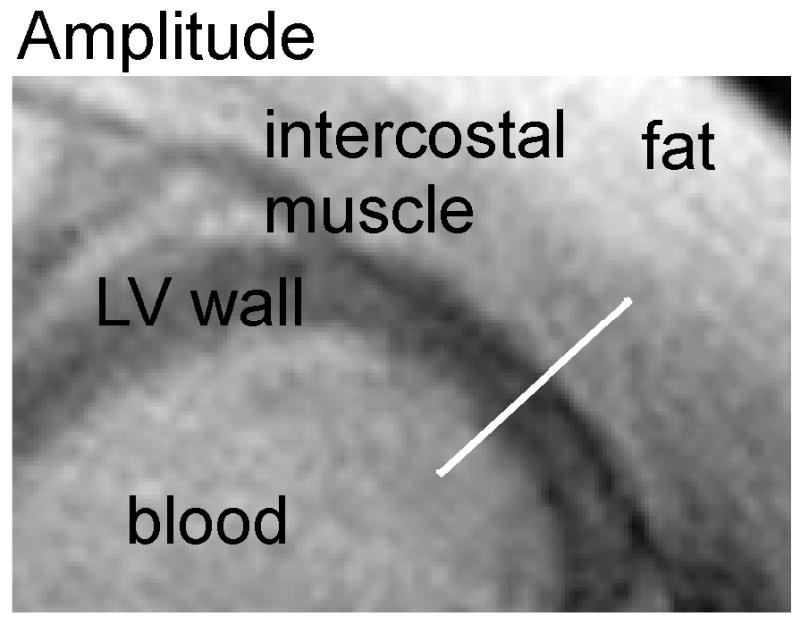
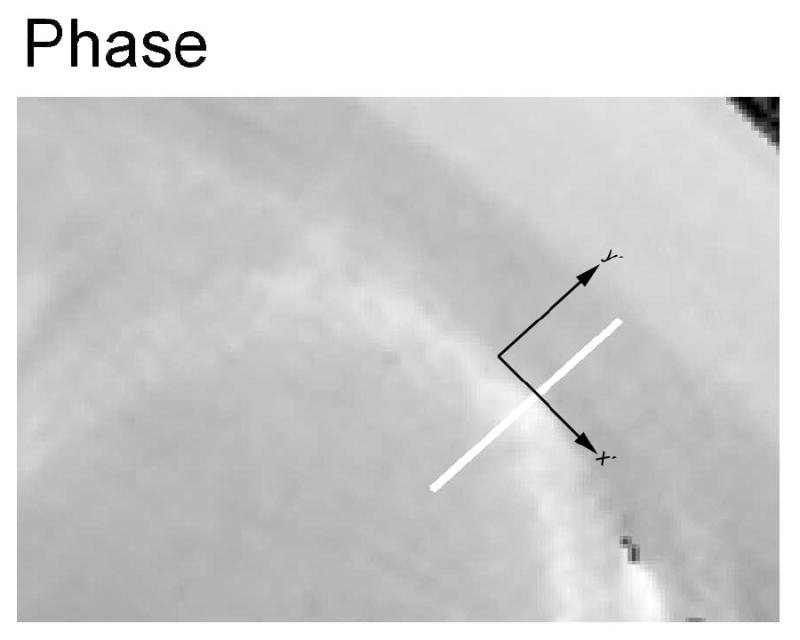
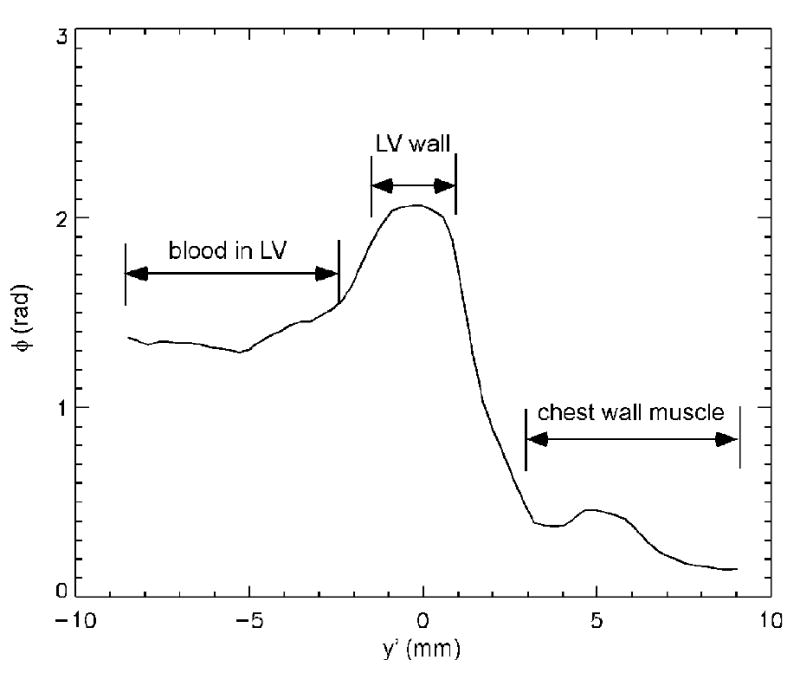
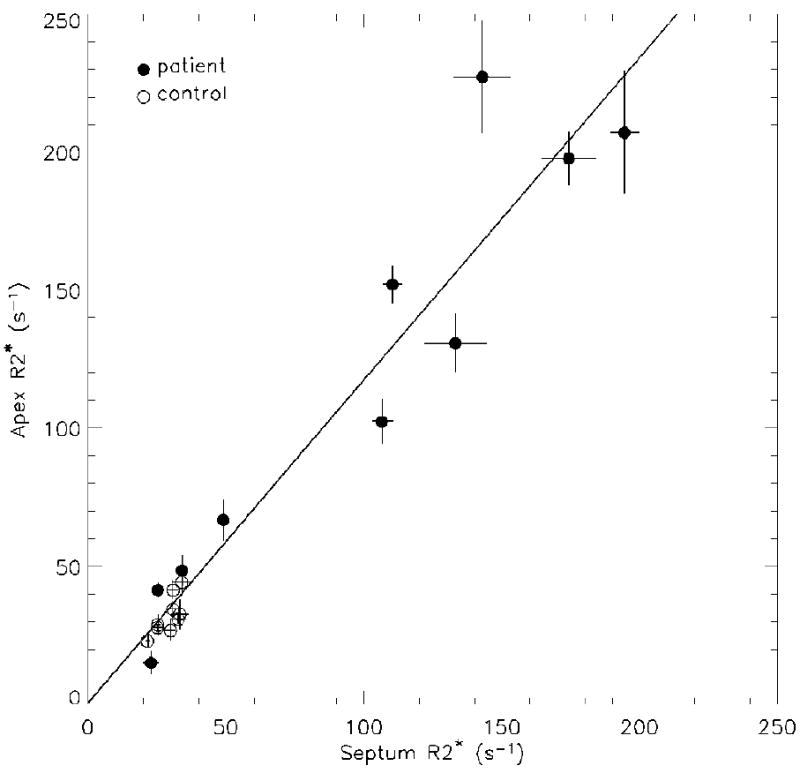
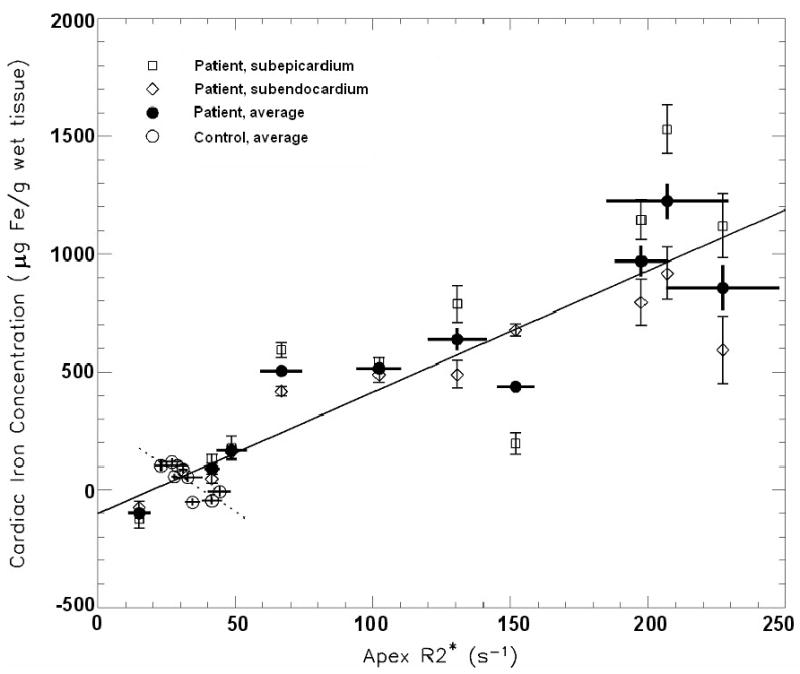
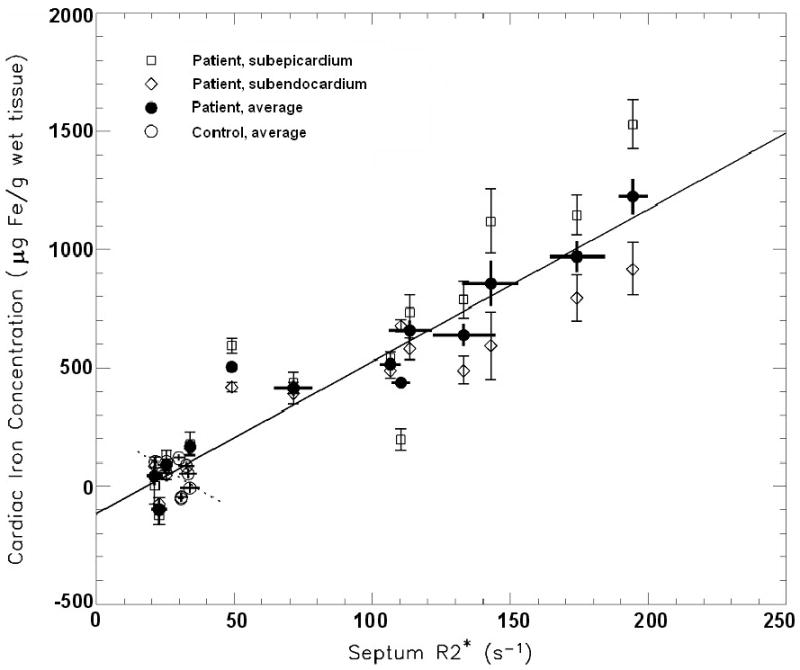
A magnetic resonance imaging cardiac magnetic susceptometry (MRI-CS) technique for assessing cardiac tissue iron concentration based on phase mapping was developed. Normal control subjects (n=9) and thalassemia patients (n=13) receiving long-term blood transfusion therapy underwent MRI-CS and MRI measurements of the cardiac relaxation rate R2*. Using MRI-CS, subepicardium and subendocardium iron concentrations were quantified exploiting the hemosiderin/ferritin iron specific magnetic susceptibility. The average of subepicardium and subendocardium iron concentrations and R2* of the septum were found to be strongly correlated (r=0.96, P<.0001), and linear regression analysis yielded CIC (microg Fe/g(wet tissue))=(6.4+/-0.4).R2* (septum) (s(-1)) - (120+/-40). The results demonstrated that septal R2* indeed measures cardiac iron level.
Keywords: MRI; R2*; heart; iron overload; magnetic susceptibility; thalassemia.
Copyright 2010 Elsevier Inc. All rights reserved.
Conflict of interest statement
Figures
Similar articles
-
R2* as a surrogate measure of ferriscan iron quantification in thalassemia.J Magn Reson Imaging. 2014 Apr;39(4):1007-11. doi: 10.1002/jmri.24216. Epub 2013 Oct 7. J Magn Reson Imaging. 2014. PMID: 24123694
-
MRI-based quantitative susceptibility mapping (QSM) and R2* mapping of liver iron overload: Comparison with SQUID-based biomagnetic liver susceptometry.Magn Reson Med. 2017 Jul;78(1):264-270. doi: 10.1002/mrm.26358. Epub 2016 Aug 11. Magn Reson Med. 2017. PMID: 27509836 Free PMC article.
-
Magnetic resonance detection of kidney iron deposition in sickle cell disease: a marker of chronic hemolysis.J Magn Reson Imaging. 2008 Sep;28(3):698-704. doi: 10.1002/jmri.21490. J Magn Reson Imaging. 2008. PMID: 18777554 Free PMC article.
-
Magnetic resonance imaging assessment of excess iron in thalassemia, sickle cell disease and other iron overload diseases.Hemoglobin. 2008;32(1-2):85-96. doi: 10.1080/03630260701699912. Hemoglobin. 2008. PMID: 18274986 Free PMC article. Review.
-
Quantification of liver iron with MRI: state of the art and remaining challenges.J Magn Reson Imaging. 2014 Nov;40(5):1003-21. doi: 10.1002/jmri.24584. Epub 2014 Mar 3. J Magn Reson Imaging. 2014. PMID: 24585403 Free PMC article. Review.
Cited by
-
Differentiation of intrapancreatic accessory spleen from pancreatic neuroendocrine tumor using MRI R2.Abdom Radiol (NY). 2025 Aug;50(8):3674-3684. doi: 10.1007/s00261-024-04758-y. Epub 2025 Jan 22. Abdom Radiol (NY). 2025. PMID: 39841231
-
The role of magnetic resonance imaging in the evaluation of transfusional iron overload in myelodysplastic syndromes.Rev Bras Hematol Hemoter. 2015 Jul-Aug;37(4):252-8. doi: 10.1016/j.bjhh.2015.03.014. Epub 2015 May 19. Rev Bras Hematol Hemoter. 2015. PMID: 26190429 Free PMC article.
-
Kidney R2* Mapping for Noninvasive Evaluation of Iron Overload in Paroxysmal Nocturnal Hemoglobinuria.Magn Reson Med Sci. 2025 Apr 1;24(2):204-209. doi: 10.2463/mrms.mp.2023-0114. Epub 2024 Feb 16. Magn Reson Med Sci. 2025. PMID: 38369335 Free PMC article.
-
Simultaneous field and R2 mapping to quantify liver iron content using autoregressive moving average modeling.J Magn Reson Imaging. 2012 May;35(5):1125-32. doi: 10.1002/jmri.23545. Epub 2011 Dec 16. J Magn Reson Imaging. 2012. PMID: 22180325 Free PMC article.
-
Automated T(2) * measurements using supplementary field mapping to assess cardiac iron content.J Magn Reson Imaging. 2013 Aug;38(2):441-7. doi: 10.1002/jmri.23990. Epub 2013 Jan 4. J Magn Reson Imaging. 2013. PMID: 23292658 Free PMC article.
References
-
- Cohen AR, Galanello R, Pennell DJ, Cunningham MJ, Vichinsky E. Thalassemia, in Hematology, the American Society of Hematology Education Program Book. 2004. pp. 14–34. - PubMed
-
- Borgna-Pignatti C, Rugolotto S, De Stefano P, Zhao H, Cappellini MD, Del Vecchio GC, Romeo MA, Forni GL, Gamberini MR, Ghilardi R, Piga A, Cnaan A. Survival and complications in patients with thalassemia major treated with transfusion and deferoxamine. Haematologica. 2004;89:1187–93. - PubMed
-
- Fischer R, Tiemann C, Engelhardt R, Nielsen P, Durken M, Gabbe E, Janka G. Assessment of iron stores in children with transfusion siderosis by biomagnetic liver susceptometry. Am J Hematol. 1999;60:289–299. - PubMed
-
- Olivieri NF, Brittenham GM. Iron-chelating therapy and the treatment of thalassemia. Blood. 1997;89:739–761. - PubMed
-
- Anderson LJ, Holden S, Davis B, Prescott E, Charrier CC, Bunce NH, Firmin DN, Wonke B, Porter J, Walker JM, Pennell DJ. Cardiovascular T2-star (T2*) magnetic resonance for the early diagnosis of myocardial iron overload. Eur Heart J. 2001;22:2171–2179. - PubMed
Publication types
MeSH terms
Substances
Grants and funding
LinkOut - more resources
Full Text Sources
Other Literature Sources
Medical
Miscellaneous
