

A unified genetic, computational and experimental framework identifies functionally relevant residues of the homing endonuclease I-BmoI
- PMID: 20061372
- PMCID: PMC2853131
- DOI: 10.1093/nar/gkp1223
A unified genetic, computational and experimental framework identifies functionally relevant residues of the homing endonuclease I-BmoI
Abstract
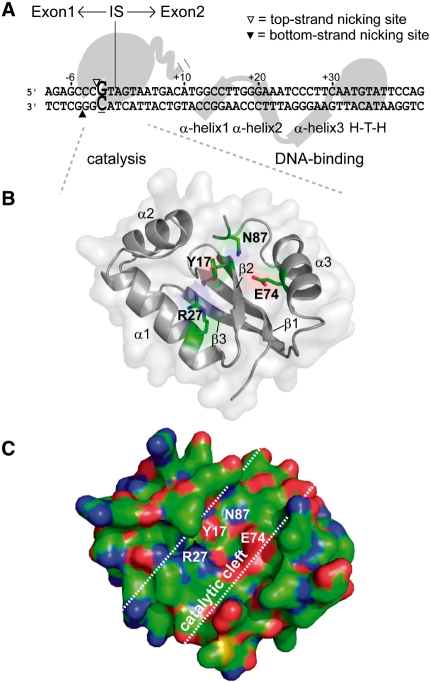
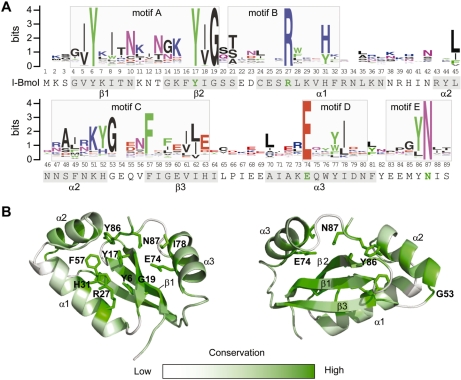
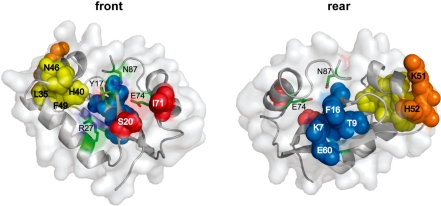
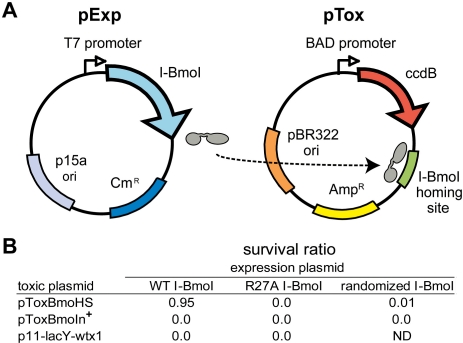
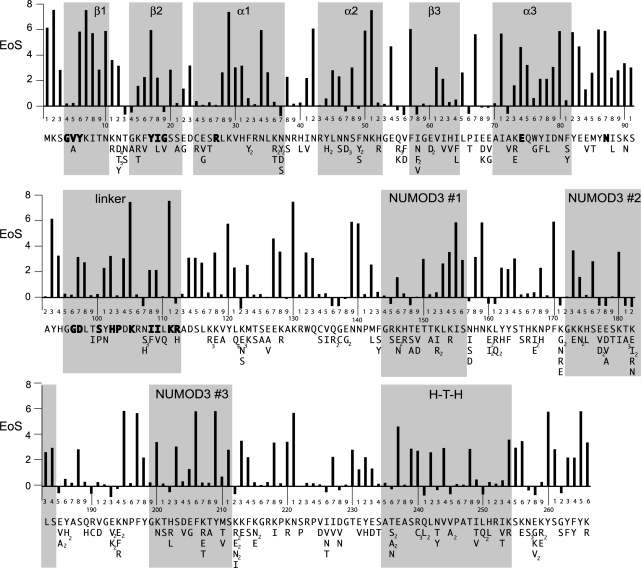
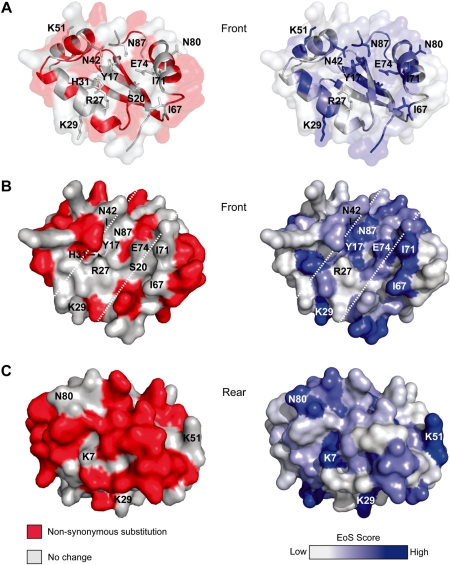
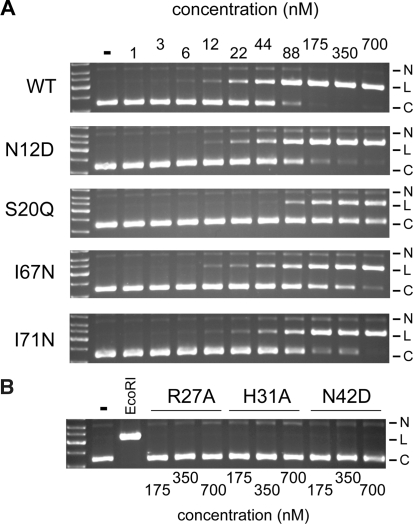
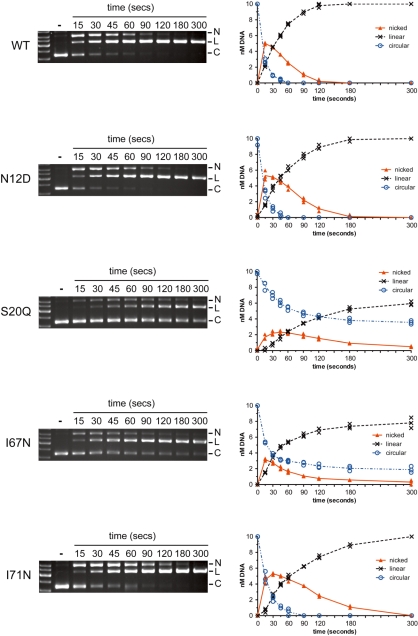
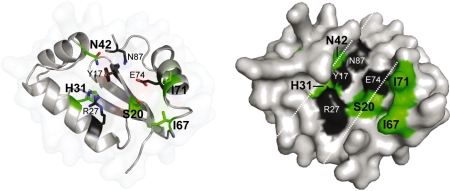
Insight into protein structure and function is best obtained through a synthesis of experimental, structural and bioinformatic data. Here, we outline a framework that we call MUSE (mutual information, unigenic evolution and structure-guided elucidation), which facilitated the identification of previously unknown residues that are relevant for function of the GIY-YIG homing endonuclease I-BmoI. Our approach synthesizes three types of data: mutual information analyses that identify co-evolving residues within the GIY-YIG catalytic domain; a unigenic evolution strategy that identifies hyper- and hypo-mutable residues of I-BmoI; and interpretation of the unigenic and co-evolution data using a homology model. In particular, we identify novel positions within the GIY-YIG domain as functionally important. Proof-of-principle experiments implicate the non-conserved I71 as functionally relevant, with an I71N mutant accumulating a nicked cleavage intermediate. Moreover, many additional positions within the catalytic, linker and C-terminal domains of I-BmoI were implicated as important for function. Our results represent a platform on which to pursue future studies of I-BmoI and other GIY-YIG-containing proteins, and demonstrate that MUSE can successfully identify novel functionally critical residues that would be ignored in a traditional structure-function analysis within an extensively studied small domain of approximately 90 amino acids.
Figures
Similar articles
-
The monomeric GIY-YIG homing endonuclease I-BmoI uses a molecular anchor and a flexible tether to sequentially nick DNA.Nucleic Acids Res. 2013 May 1;41(10):5413-27. doi: 10.1093/nar/gkt186. Epub 2013 Apr 4. Nucleic Acids Res. 2013. PMID: 23558745 Free PMC article.
-
Strand-specific contacts and divalent metal ion regulate double-strand break formation by the GIY-YIG homing endonuclease I-BmoI.J Mol Biol. 2007 Nov 23;374(2):306-21. doi: 10.1016/j.jmb.2007.09.027. Epub 2007 Sep 16. J Mol Biol. 2007. PMID: 17936302
-
Distance determination by GIY-YIG intron endonucleases: discrimination between repression and cleavage functions.Nucleic Acids Res. 2006 Mar 31;34(6):1755-64. doi: 10.1093/nar/gkl079. Print 2006. Nucleic Acids Res. 2006. PMID: 16582101 Free PMC article.
-
Crystallographic and bioinformatic studies on restriction endonucleases: inference of evolutionary relationships in the "midnight zone" of homology.Curr Protein Pept Sci. 2003 Oct;4(5):327-37. doi: 10.2174/1389203033487072. Curr Protein Pept Sci. 2003. PMID: 14529527 Review.
-
The functional importance of co-evolving residues in proteins.Cell Mol Life Sci. 2014 Feb;71(4):673-82. doi: 10.1007/s00018-013-1458-2. Epub 2013 Sep 1. Cell Mol Life Sci. 2014. PMID: 23995987 Free PMC article. Review.
Cited by
-
Custom CRISPR-Cas9 PAM variants via scalable engineering and machine learning.Nature. 2025 Jul;643(8071):539-550. doi: 10.1038/s41586-025-09021-y. Epub 2025 Apr 22. Nature. 2025. PMID: 40262634
-
Engineered CRISPR-Cas9 nucleases with altered PAM specificities.Nature. 2015 Jul 23;523(7561):481-5. doi: 10.1038/nature14592. Epub 2015 Jun 22. Nature. 2015. PMID: 26098369 Free PMC article.
-
Precise DNA cleavage using CRISPR-SpRYgests.Nat Biotechnol. 2023 Mar;41(3):409-416. doi: 10.1038/s41587-022-01492-y. Epub 2022 Oct 6. Nat Biotechnol. 2023. PMID: 36203014 Free PMC article.
-
Natural and engineered nicking endonucleases--from cleavage mechanism to engineering of strand-specificity.Nucleic Acids Res. 2011 Jan;39(1):1-18. doi: 10.1093/nar/gkq742. Epub 2010 Aug 30. Nucleic Acids Res. 2011. PMID: 20805246 Free PMC article. Review.
-
A generalizable Cas9/sgRNA prediction model using machine transfer learning with small high-quality datasets.Nat Commun. 2023 Sep 7;14(1):5514. doi: 10.1038/s41467-023-41143-7. Nat Commun. 2023. PMID: 37679324 Free PMC article.
References
-
- Capra JA, Singh M. Predicting functionally important residues from sequence conservation. Bioinformatics. 2007;23:1875–1882. - PubMed
-
- Watson JD, Laskowski RA, Thornton JM. Predicting protein function from sequence and structural data. Curr. Opin. Struct. Biol. 2005;15:275–284. - PubMed
-
- Martin LC, Gloor GB, Dunn SD, Wahl LM. Using information theory to search for co-evolving residues in proteins. Bioinformatics. 2005;21:4116–4124. - PubMed
-
- Tillier ER, Lui TW. Using multiple interdependency to separate functional from phylogenetic correlations in protein alignments. Bioinformatics. 2003;19:750–755. - PubMed
Publication types
MeSH terms
Substances
LinkOut - more resources
Full Text Sources
Other Literature Sources
Molecular Biology Databases
Miscellaneous
