Meta-Analysis
. 2010 Apr;38(7):2332-45.
doi: 10.1093/nar/gkp1205. Epub 2010 Jan 8.

Genome-wide identification of hypoxia-inducible factor binding sites and target genes by a probabilistic model integrating transcription-profiling data and in silico binding site prediction

Affiliations
Meta-Analysis

Genome-wide identification of hypoxia-inducible factor binding sites and target genes by a probabilistic model integrating transcription-profiling data and in silico binding site prediction

Amaya Ortiz-Barahona et al. Nucleic Acids Res. 2010 Apr.

Abstract

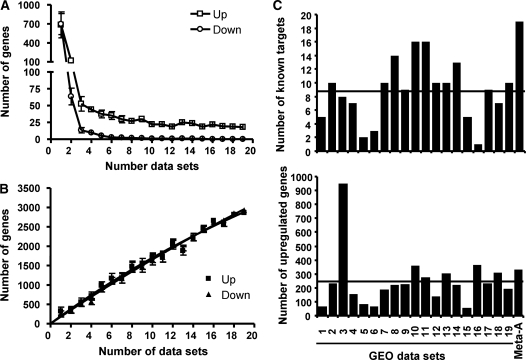
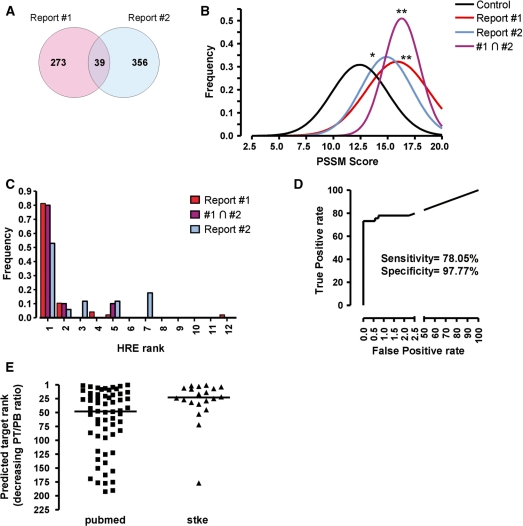
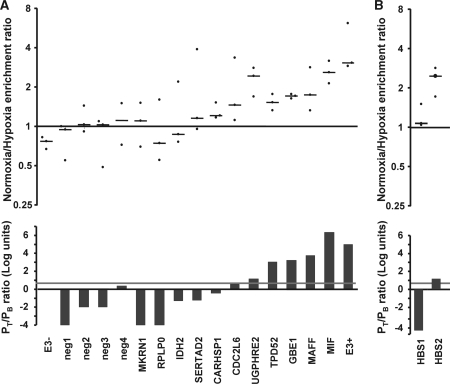
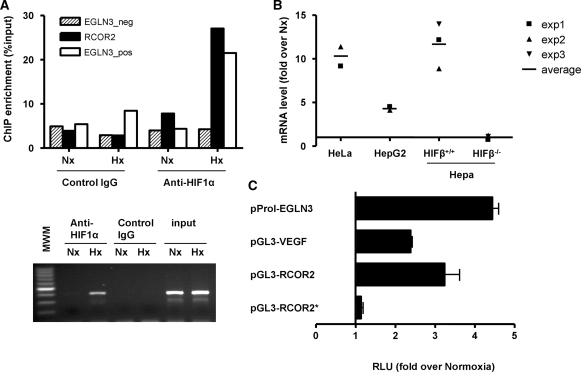
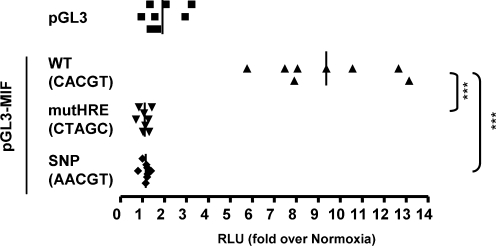
The transcriptional response driven by Hypoxia-inducible factor (HIF) is central to the adaptation to oxygen restriction. Hence, the complete identification of HIF targets is essential for understanding the cellular responses to hypoxia. Herein we describe a computational strategy based on the combination of phylogenetic footprinting and transcription profiling meta-analysis for the identification of HIF-target genes. Comparison of the resulting candidates with published HIF1a genome-wide chromatin immunoprecipitation indicates a high sensitivity (78%) and specificity (97.8%). To validate our strategy, we performed HIF1a chromatin immunoprecipitation on a set of putative targets. Our results confirm the robustness of the computational strategy in predicting HIF-binding sites and reveal several novel HIF targets, including RE1-silencing transcription factor co-repressor (RCOR2). In addition, mapping of described polymorphisms to the predicted HIF-binding sites identified several single-nucleotide polymorphisms (SNPs) that could alter HIF binding. As a proof of principle, we demonstrate that SNP rs17004038, mapping to a functional hypoxia response element in the macrophage migration inhibitory factor (MIF) locus, prevents induction of this gene by hypoxia. Altogether, our results show that the proposed strategy is a powerful tool for the identification of HIF direct targets that expands our knowledge of the cellular adaptation to hypoxia and provides cues on the inter-individual variation in this response.


Figures

Figure 1.
Figure 1.
Comparison of individual gene profiling studies versus meta-analysis. The indicated number of data sets (number of data sets) was randomly selected out from the 19 GEO tables without replacement. The number of genes whose expression was 1.96 SD from the mean in all (A) or at least in one (B) of the selected data set was recorded and the procedure repeated 10 times. The graph represents the mean number of recorded genes and error bars the standard deviation. (C) For each individual data set (1 to 19, see Supplementary Table S2), the genes showing a fold induction ratio >2.6 SD above the mean were considered upregulated. In the case of the meta-analysis (Meta-A), genes with a corrected P-value <0.01 and mean fold induction positive were considered upregulated. The graph represents the number of known target genes (according to ref. 1) represented in the upregulated group in each case (upper graph) together with the total number of upregulated genes (lower graph). The horizontal lines in each graph represent the average number of known and upregulated genes across the 19 data sets.
Figure 2.
Figure 2.
High HBS scores correlate with functional HIF-binding sites. (A) Venn diagram showing the number of overlapping HIF-binding sites identified by ChIP–chip in two published reports (ref. 29, Report #1; ref. 28, Report #2). (B) The scores of HBSs identified by our strategy were discretized (binning size 0.5 U) and their frequency distribution was calculated and adjusted to a Gauss curve by nonlinear fitting. The graph shows the resulting curves for all the HBSs identified across the genome (control), the HBSs mapping to HIF-binding regions identified by ChIP–chip in each report (Report #1, Report #2) or those HBS in regions common to both reports (#1∩#2). The scores in each group were compared (ANOVA) and statistically significant differences with the control group are indicated by asterisks (*, P < 0.01; **, P < 0.001). (C) The potential HBSs identified for each gene were ranked according to their score in decreasing order (rank 1 corresponds to the highest scoring HBS) and the rank of the predicted HBSs mapping to HIF-binding sites was recorded. The figure shows the rank frequency distribution for predicted HBSs mapping to HIF-binding regions identified by ChIP–Chip in each report (Report #1, Report #2) or regions common to both reports (#1∩#2). (D) Receiver operating characteristic (ROC) curve of known positive/negative (see text) targets versus prediction using a PT/PB ratio of 6.5 as threshold to classify genes as potential targets. (E) Genes identified as potential targets (PT/PB ratio >6.5) were sorted in decreasing PT/PB ratio order. The graph represents the rank of known HIF targets, according to ref. 1 (Stke) or a bibliographic search (PubMed), within the predicted target list. Horizontal line represents the median of each group.
Figure 3.
Figure 3.
Experimental validation of HIF binding to predicted sites. HeLa cells were exposed to normoxia or hypoxia (1% oxygen) for 6 h. After treatments, cells were processed for chromatin immunoprecipitation using antibodies directed to HIF1a. The binding of HIF1a to the predicted HBS within the indicated genes (A) was determined by qPCR. In the case of UGP2, HIF binding to two conserved HBSs was tested (B). The graph shows the ratio of the immunoprecipitated material in hypoxia over normoxia. The results from three independent experiments (black circles) and their median (line) are shown. In order to normalize data from the three independent experiments, the hypoxia/normoxia ratio is represented as fold over the mean value obtained for all the negative controls in each experiment. Neg1, IRS4; neg 2, STT3A; neg 3, HIVEP; neg4, LTBP1. The binding of HIF1a to the HRE within EGLN3 enhancer (E3+) or to a nonfunctional RCGTG within EGLN3 locus (E3–) were used as internal controls (ref. 31). For comparison, PT/PB ratio (in logarithmic scale) for each target is shown (bottom histogram), along with the threshold value of 6.5 (red line).
Figure 4.
Figure 4.
RCOR2 is a HIF-target gene. (A) HeLa cells were exposed to normoxia (Nx) or hypoxia (Hx, 1% oxygen) for 12 h. After treatments, cells were processed for chromatin immunoprecipitation using antibodies directed to HIF1a (anti-HIF1a) or control immunoglobulins (control IgG). The binding of HIF1a to the predicted HRE within RCOR2, to the HRE within EGLN3 enhancer (EGLN3_pos) or to a nonfunctional RCGTG within EGLN3 locus (EGLN3_neg) were determined by quantitative (upper panel) and semi-quantitative PCR (RCOR2, lower panel). MWM, molecular weight marker. (B) HeLa, HepG2 and Hepa C1/C4 cells were exposed to normoxia or hypoxia for 12 h and the level of RCOR2 mRNA was determined by quantitative PCR. The amount of each mRNA in samples was normalized to the content of β-actin mRNA in the same sample. The graph represents the fold values of hypoxic over normoxic mRNA levels normalized to the value of 1 (horizontal axis). Data represents the values from three independent experiments and their average (horizontal bar). (C) HepG2 cells were transfected with a reporter plasmid containing RCOR2 promoter region (−1770 to −795) upstream a luciferase reporter gene. Where indicated (asterisk) the consensus HRE sequence (ACGT) was mutated to TAGC. For comparison, reporter constructs containing the EGLN3 enhancer and VEGF promoter were included. The graphs represent the corrected luciferase activity values of each hypoxic sample over the luciferase activity obtained in normoxic cells. Data shown are a representative experiment out of three independent determinations.
Figure 5.
Figure 5.
The allelic variant C/A (rs17004038) abrogates MIF induction by hypoxia. HeLa cells transfected with a reporter plasmid containing MIF genomic region (−31 to +108) upstream a luciferase reporter gene. Where indicated the consensus HRE sequence (CACGT) was mutated to CTAGC (mutHRE) or to AACGT (SNP). The graph represents the corrected luciferase activity values of each construct in cells exposed to hypoxia over the luciferase activity obtained in normoxic cells. Data show the results for eight experiments and its mean value (vertical line). Statistically significant differences with control group (WT) are indicated by asterisks (***p < 0.001).

Similar articles

Cited by

References

    1. Wenger RH, Stiehl DP, Camenisch G. Integration of oxygen signaling at the consensus HRE. Sci. STKE. 2005;2005:re12. - PubMed
    1. Semenza GL, Wang GL. A nuclear factor induced by hypoxia via de novo protein synthesis binds to the human erythropoietin gene enhancer at a site required for transcriptional activation. Mol. Cell. Biol. 1992;12:5447–5454. - PMC - PubMed
    1. Salceda S, Beck I, Caro J. Absolute requirement of aryl hydrocarbon receptor nuclear translocator protein for gene activation by hypoxia. Arch. Biochem. Biophys. 1996;334:389–394. - PubMed
    1. Salceda S, Caro J. Hypoxia-inducible factor 1alpha (HIF-1alpha) protein is rapidly degraded by the ubiquitin-proteasome system under normoxic conditions. Its stabilization by hypoxia depends on redox-induced changes. J. Biol. Chem. 1997;272:22642–22647. - PubMed
    1. Jiang BH, Zheng JZ, Leung SW, Roe R, Semenza GL. Transactivation and inhibitory domains of hypoxia-inducible factor 1alpha. Modulation of transcriptional activity by oxygen tension. J. Biol. Chem. 1997;272:19253–19260. - PubMed

Publication types

Substances