. 2010 Mar 26;285(13):10030-10043.
doi: 10.1074/jbc.M109.064196. Epub 2010 Jan 8.

Pro-hormone secretogranin II regulates dense core secretory granule biogenesis in catecholaminergic cells

Affiliations

Pro-hormone secretogranin II regulates dense core secretory granule biogenesis in catecholaminergic cells

Maïté Courel et al. J Biol Chem. .

Abstract

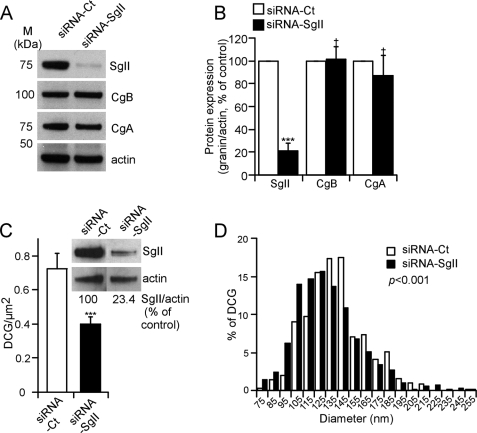
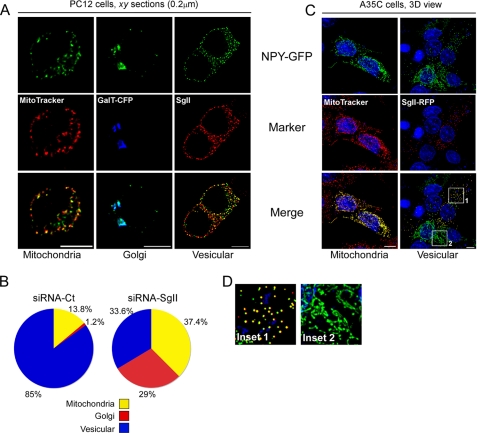
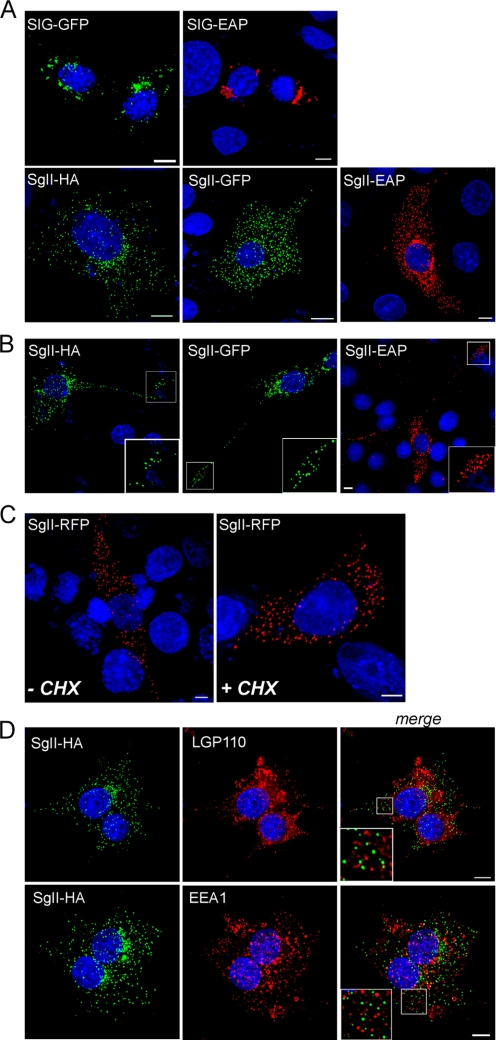
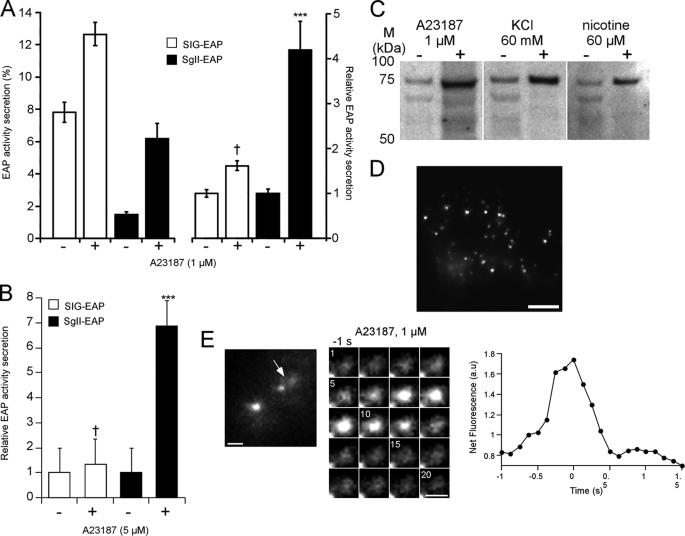
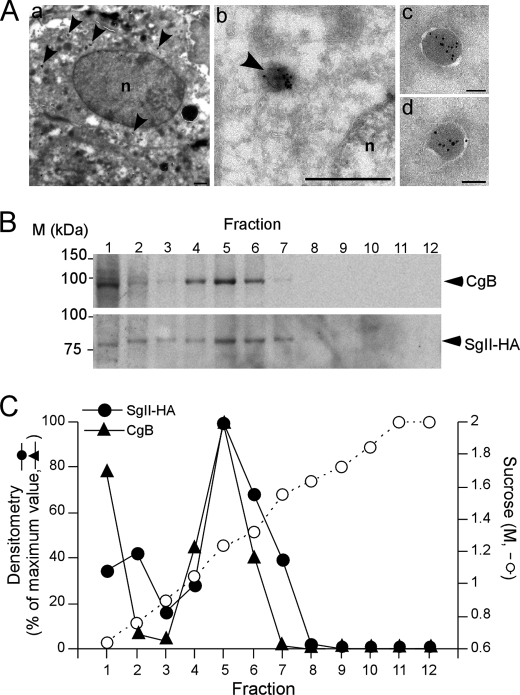
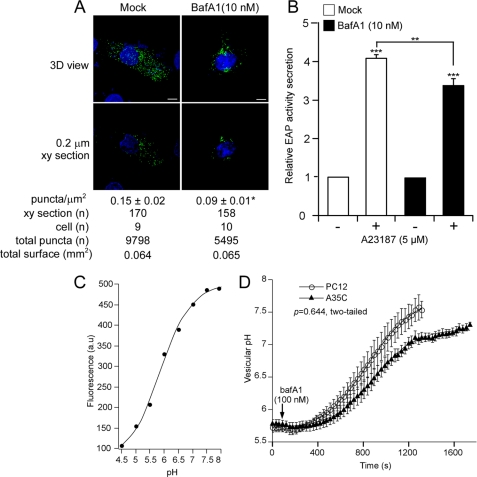
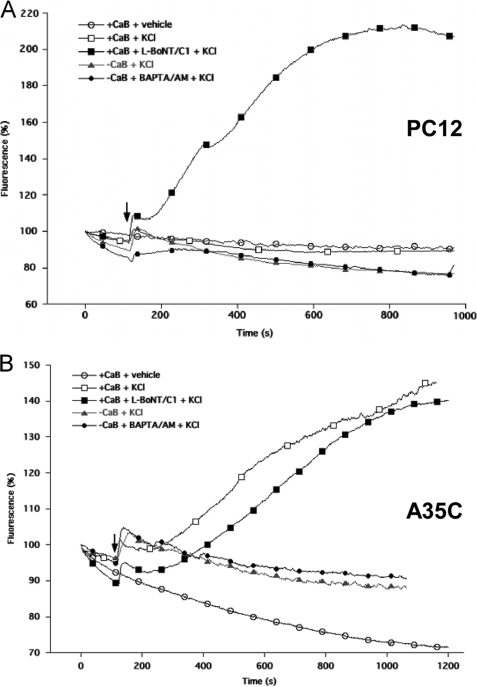
Processes underlying the formation of dense core secretory granules (DCGs) of neuroendocrine cells are poorly understood. Here, we present evidence that DCG biogenesis is dependent on the secretory protein secretogranin (Sg) II, a member of the granin family of pro-hormone cargo of DCGs in neuroendocrine cells. Depletion of SgII expression in PC12 cells leads to a decrease in both the number and size of DCGs and impairs DCG trafficking of other regulated hormones. Expression of SgII fusion proteins in a secretory-deficient PC12 variant rescues a regulated secretory pathway. SgII-containing dense core vesicles share morphological and physical properties with bona fide DCGs, are competent for regulated exocytosis, and maintain an acidic luminal pH through the V-type H(+)-translocating ATPase. The granulogenic activity of SgII requires a pH gradient along this secretory pathway. We conclude that SgII is a critical factor for the regulation of DCG biogenesis in neuroendocrine cells, mediating the formation of functional DCGs via its pH-dependent aggregation at the trans-Golgi network.


Figures

FIGURE 1.
FIGURE 1.
Depletion and altered secretory granule morphology in response to siRNA-mediated silencing of SgII in wild-type sympathoadrenal PC12 cells. A, granins expression. Representative immunoblot of granins expression after siRNA silencing of SgII. Cell lysates from PC12 cells transfected with either siRNA-Ct or siRNA-SgII (96 h) were subjected to immunoblot detection of SgII, CgB, and CgA expression. Actin served as a normalization control. B, quantification of relative granin expression. The normalized SgII, CgB, and CgA expression in siRNA-Ct-treated cells was considered to be 100%. Values are given as the mean relative protein expression of seven independent experiments ± S.E. †, p > 0.05; ***, p < 0.001, t test. C and D, ultrastructural analyses of dense core granules after siRNA silencing of SgII. Micrographs from PC12 cells treated with siRNA-Ct or siRNA-SgII were analyzed for number of dense core granules per μm2 of cytoplasm (C) and diameter (nm) (D). n = 187 (siRNA-Ct) and 127 (siRNA-SgII) cell planes. C, immunoblot inset represents SgII expression before sample processing, quantified as described in B. ***, p < 0.001, Kruskal-Wallis test. D, dense core granule diameters were calculated from 572 (siRNA-Ct) and 586 (siRNA-SgII) randomly selected dense core granules. Values were ranked according to interval, and the distribution of the resulting populations was compared using a Kruskal-Wallis test.
FIGURE 2.
FIGURE 2.
SgII is required for the correct trafficking of NPY-GFP into secretory granules. A and B, effect of SgII silencing on secretory granule targeting of NPY in PC12 cells. PC12 cells treated with siRNA-Ct or siRNA-SgII (96 h) were transfected with a plasmid encoding NPY-GFP for 24 h and analyzed by three-dimensional deconvolution microscopy after processing for photoprotein fluorescence and immunocytochemistry. A, representative optical xy sections of the three archetypal distributions of NPY-GFP observed in PC12 cells. MitoTracker Red CMXros, GalT-CFP, and endogenous SgII were used as markers of mitochondrial, Golgi, or DCG distribution, respectively. Scale bar, 5 μm. B, relative subcellular distribution of NPY-GFP in control or silenced PC12 cells. The pattern of NPY-GFP localization in transfected cells (n = 87, siRNA-Ct; n = 107, siRNA-SgII) was classified according to A. Values are expressed as a percentage of the number of analyzed cells. p < 0.0001, row by column contingency table (χ2 = 58.7, 2 degrees of freedom). C and D, expression of SgII reroutes NPY from tubular to vesicular organelles in A35C cells. A35C cells transiently transfected (48 h) with the plasmid encoding NPY-GFP, alone or together with a plasmid encoding SgII-RFP, were processed for photoprotein fluorescence and three-dimensional deconvolution microscopy. C, representative three-dimensional (3D) views of 9–13 optical xy sections acquired along the z axis. MitoTracker Red CMXros was used as a marker of the mitochondrial network. Nuclei (blue) were visualized with Hoechst 33342. Scale bars, 5 μm. Co-localization (yellow) of NPY-GFP (green) with either mitochondria or SgII-RFP photoprotein (red) is shown in the merged images. Quantification of fluorescence overlap is reported in the text. D, enlarged insets from C emphasize the punctate co-localization of NPY-GFP in presence of SgII-RFP (inset 1) as opposed to the mitochondrial distribution of NPY-GFP in absence of SgII-RFP signal (inset 2).
FIGURE 3.
FIGURE 3.
Subcellular distribution of SgII fusion proteins expressed in neurosecretion-deficient sympathoadrenal A35C cells. A35C cells transfected (48 h) with expression plasmids encoding the indicated fusion proteins were processed for photoprotein fluorescence or immunocytochemistry and three-dimensional deconvolution microscopy. Shown are the three-dimensional views of 9–13 optical xy sections acquired along the z axis. Nuclei were visualized with Hoechst 33342 (blue). SIG-EAP, SgII-EAP (red), and SgII-HA (green) chimera were detected using the appropriate anti-reporter antibodies. Scale bars, 5 μm. A, cell bodies. B, neurites. Substantial accumulation of SgII-HA/GFP/EAP chimeric proteins is seen at the end of neurite-like structures, as exemplified in the enlarged insets of the deconvolved images. C, A35C cells expressing SgII-RFP were treated (3 h) with a mock buffer (DMSO; −CHX) or the protein synthesis inhibitor cycloheximide (CHX) (10 μg/ml; +CHX) prior to processing for photoprotein fluorescence. D, A35C-S7 cells (stably expressing SgII-HA) were co-stained for SgII-HA (green) and the lysosomal/late endosomal marker LGP110 or the early endosomal marker EEA1 (red). Absence of co-localization between SgII-HA and lysosomal or endosomal structures is exemplified in the enlarged insets from the merged three-dimensional images.
FIGURE 4.
FIGURE 4.
Secretagogue-stimulated exocytosis of SgII in COS-7 and A35C cells. A and B, regulated secretion of EAP fusion proteins. COS-7 cells (A) and A35C cells (B) expressing SIG-EAP or SgII-EAP were exposed for 30 min to DMEM alone (−) or DMEM supplemented with the indicated concentration of A23187 (+). EAP type secretion was assayed as described under “Experimental Procedures.” Release of EAP is expressed either as % of EAP activity secretion (A, left) or relative to enzymatic activity released in the absence of secretagogue (A, right, and B). Values are given as the mean ± S.E. of triplicate determinations. Results from one of at least three independent experiments are shown. †, p > 0.05; ***, p < 0.001, as compared with control, analysis of variance with Dunnett's post-hoc test. C, stimulated release of SgII-HA from A35C-S7 cells. A35C-S7 cells were sequentially exposed for 30 min to DMEM (−) and then DMEM containing the indicated secretagogues (+). The resulting supernatants were subjected to immunoblotting. The amount of secreted SgII-HA was quantified by densitometry in three independent secretion experiments. The means ± S.E. of fold increases in stimulated (+) over basal (−) conditions were as follows: A23187, 5.9 ± 1.2; KCl, 4.8 ± 0.8; nicotine, 4.9 ± 1.7. D, TIRFM image of a characteristic A35C cell expressing SgII-GFP. Only the pool of vesicles within ∼140 nm from the plasma membrane in the z axis (corresponding to the estimated penetration depth of the evanescent wave used to excite GFP) is seen. Scale bar, 5 μm. E, secretagogue-evoked release of SgII-GFP observed by TIRFM. The arrow in the overall view of a transfected A35C cell prior (−1 s) to stimulation with 1 μm A23187 (left) indicates the exocytotic event depicted in the adjacent sequential images. Shown on the right is the quantification of the fluorescence intensity changes measured from the sequential images.
FIGURE 5.
FIGURE 5.
Morphometric analyses of SgII-containing dense core granules in A35C cells. A, immunoelectron microscopy analysis of A35C-S7 cell line. SgII-HA was detected using a monoclonal anti-HA antibody and a secondary 10 nm gold-conjugated goat anti-mouse antibody. Panels a and b, newly formed granules are indicated by the arrowheads. Scale bars, a, 1 μm; b, 200 nm. Panels c and d, detailed structure of SgII-containing vesicles. Scale bars, 100 nm. B and C, buoyant density of dense core secretory granules from PC12 and A35C-S7. Postnuclear supernatants from a mixed population of PC12 and A35C-S7 cells were subjected to a sucrose density gradient fractionation. B, immunoblots of CgB (from PC12) and SgII-HA (from A35C-S7) distribution across the sucrose density gradient. C, quantification of CgB and SgII-HA amounts in the gradient fractions from B. Values are given as the percent maximum of either CgB or SgII-HA signal in the gradient fractions.
FIGURE 6.
FIGURE 6.
Mobility of secretory vesicles is comparable in A35C expressing SgII-GFP cells and wild-type PC12 cells. A, TIRFM image of a characteristic SgII-GFP-containing granule in a transfected A35C cell. The granule trajectory in the xy plane (green line) over a period of 300 s was used to generate x and y coordinates and calculate the MSD and diffusion coefficient values. Scale bar, 100 nm. B, x and y coordinates extracted from A as a function of time. C, MSD from the origin as a function of time obtained from B. D, mobility of SgII-containing granules in SgII-GFP-expressing A35C versus PC12 cells. Diffusion coefficients (Dxy) values from 171 vesicles in 12 A35C cells and 141 vesicles in 12 PC12 cells were ranked according to histogram intervals and compared using a Mann-Whitney two-tail test.
FIGURE 7.
FIGURE 7.
Effects of the vacuolar H+-V-ATPase inhibitor BafA1 on the granule forming activity of SgII and the regulation of pHves in SgII-expressing A35C cells. A, subcellular distribution of SgII-GFP in A35C cells treated with BafA1. A35C transfected with SgII-GFP and exposed (22 h) to mock (DMSO) or BafA1 (10 nm) were analyzed by deconvolution microscopy. Shown are representative three-dimensional (3D) images or xy section (0.2 μm) views. Nuclei were visualized with Hoechst 33342 (blue). Scale bars, 5 μm. *, p < 0.05, t test. B, secretagogue-evoked release of SgII-EAP after BafA1 treatment. A35C cells transfected with SgII-EAP and exposed (22 h) to mock (DMSO) or BafA1 (10 nm) were subjected to a 30-min exposure to DMEM alone (−) or DMEM supplemented with 5 μm A23187 (+) and assayed for EAP secretion. The release of EAP is expressed relative to enzymatic activity released in the absence of secretagogue. Values are given as the mean ± S.E. of three independent experiments, each done in triplicate. **, p < 0.005; ***, p < 0.001, as compared with control, analysis of variance with Bonferroni's post hoc test. C, representative pH titration curve of SgII-GFP fluorescence. a.u., arbitrary units. D, effect of BafA1 on pHves in A35C versus PC12 cells. PC12 and A35C cells (n = 5) expressing SgII-GFP were exposed to 100 nm BafA1. Fluorescence was monitored every 30 s over a 20-min period, and algebraic conversion of GFP fluorescence to pH values was obtained as described under “Experimental Procedures,” using the pH titration curve shown in C. Values are given as the mean ± S.E. Kinetics of pH increase were compared using a Mann-Whitney two-tail test.
FIGURE 8.
FIGURE 8.
KCl depolarization induces alkalinization of SgII-GFP-containing granules in PC12 and A35C cells. Kinetics of fluorescence changes following KCl depolarization in PC12 cells (A) or A35C cells (B) expressing SgII-GFP alone or together with botulinum neurotoxin C1 light chain (+L-BoNT/C1). Cells were preincubated for 10 min in either a calcium-containing buffer (+CaB), a calcium-depleted buffer (−CaB), or a calcium-depleted buffer containing 50 mm of BAPTA/AM (−CaB + BAPTA/AM). Whole cell fluorescence was continuously monitored (500-ms acquisition frames) over a 20-min period. Superfusion of 50 mm KCl (+KCl) or H2O (vehicle) was performed at the indicated time (black arrow). Changes in fluorescence are expressed as a percentage of the fluorescence present in the cell before superfusion. Measurements were done in triplicate for each cell type, in at least three independent experiments. Shown are the kinetics of one typical transfected cell.

Similar articles

Cited by

References

    1. Chen Y., Rao F., Rodriguez-Flores J. L., Mahata M., Fung M. M., Stridsberg M., Vaingankar S. M., Wen G., Salem R. M., Das M., Cockburn M. G., Schork N. J., Ziegler M. G., Hamilton B. A., Mahata S. K., Taupenot L., O'Connor D. T. (2008) J. Am. Coll. Cardiol. 52, 1468–1481 - PMC - PubMed
    1. Wen G., Wessel J., Zhou W., Ehret G. B., Rao F., Stridsberg M., Mahata S. K., Gent P. M., Das M., Cooper R. S., Chakravarti A., Zhou H., Schork N. J., O'connor D. T., Hamilton B. A. (2007) Hum. Mol. Genet. 16, 1752–1764 - PMC - PubMed
    1. Morvan J., Tooze S. A. (2008) Histochem. Cell Biol. 129, 243–252 - PMC - PubMed
    1. Taupenot L., Harper K. L., O'Connor D. T. (2003) N. Engl. J. Med. 348, 1134–1149 - PubMed
    1. Chanat E., Huttner W. B. (1991) J. Cell Biol. 115, 1505–1519 - PMC - PubMed

Publication types

LinkOut - more resources