

Fatty diabetic lung: altered alveolar structure and surfactant protein expression
- PMID: 20061442
- PMCID: PMC2838676
- DOI: 10.1152/ajplung.00041.2009
Fatty diabetic lung: altered alveolar structure and surfactant protein expression
Abstract
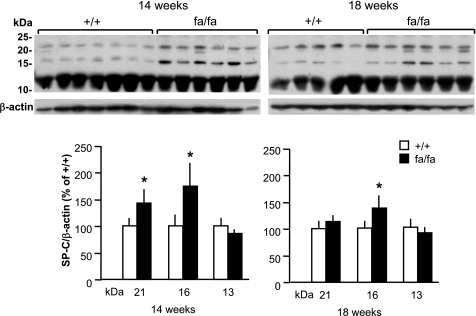
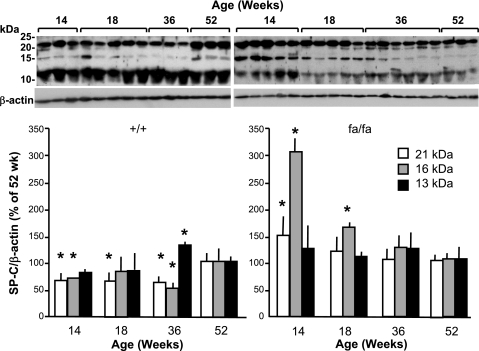
Pulmonary dysfunction develops in type 2 diabetes mellitus (T2DM) in direct correlation with glycemia and is exacerbated by obesity; however, the associated structural derangement has not been quantified. We studied lungs from obese diabetic (fa/fa) male Zucker diabetic fatty (ZDF) rats at 4, 12, and 36 wk of age, before and after onset of T2DM, compared with lean nondiabetic (+/+) rats. Surfactant proteins A and C (SP-A and SP-C) immunoexpression in lung tissue was quantified at ages 14 and 18 wk, after the onset of T2DM. In fa/fa animals, lung volume was normal despite obesity. Numerous lipid droplets were visible within alveolar interstitium, lipofibroblasts, and macrophages, particularly in subpleural regions. Total triglyceride content was 136% higher. By 12 wk, septum volume was 21% higher, and alveolar duct volume was 36% lower. Capillary basement membrane was 29% thicker. Volume of lamellar bodies was 45% higher. By age 36 wk, volumes of interstitial collagen fibers, cells, and matrix were respectively 32, 25, and 80% higher, and capillary blood volume was 18% lower. ZDF rats exhibited a strain-specific increase in resistance of the air-blood diffusion barrier with age, which was exaggerated in fa/fa lungs compared with +/+ lungs. In fa/fa lungs, SP-A and SP-C expression were elevated at age 14-18 wk; the normal age-related increase in SP-A expression was accelerated, whereas SP-C expression declined with age. Thus lungs from obese T2DM animals develop many qualitatively similar changes as in type 1 diabetes mellitus but with extensive lipid deposition, altered alveolar type 2 cell ultrastructure, and surfactant protein expression patterns that suggest additive effects of hyperglycemia and lipotoxicity.
Figures


Similar articles
-
Fatty diabetic lung: functional impairment in a model of metabolic syndrome.J Appl Physiol (1985). 2010 Dec;109(6):1913-9. doi: 10.1152/japplphysiol.00549.2010. Epub 2010 Aug 26. J Appl Physiol (1985). 2010. PMID: 20798271 Free PMC article.
-
Alveolar-capillary adaptation to chronic hypoxia in the fatty lung.Acta Physiol (Oxf). 2015 Apr;213(4):933-46. doi: 10.1111/apha.12419. Epub 2014 Nov 25. Acta Physiol (Oxf). 2015. PMID: 25363080 Free PMC article.
-
Sleeve gastrectomy ameliorates alveolar structures and surfactant protein expression in lungs of obese and diabetic rats.Int J Obes (Lond). 2020 Dec;44(12):2394-2404. doi: 10.1038/s41366-020-0647-y. Epub 2020 Jul 27. Int J Obes (Lond). 2020. PMID: 32719432
-
Intraalveolar bubbles and bubble films: II. Formation in vivo through adulthood.Anat Rec. 1996 Oct;246(2):245-70. doi: 10.1002/(SICI)1097-0185(199610)246:2<245::AID-AR12>3.0.CO;2-O. Anat Rec. 1996. PMID: 8888967 Review.
-
Recent progress on surfactant protein A: cellular function in lung and kidney disease development.Am J Physiol Cell Physiol. 2020 Aug 1;319(2):C316-C320. doi: 10.1152/ajpcell.00195.2020. Epub 2020 Jul 8. Am J Physiol Cell Physiol. 2020. PMID: 32639871 Free PMC article. Review.
Cited by
-
Acclimatization of low altitude-bred deer mice ( Peromyscus maniculatus) to high altitude.J Appl Physiol (1985). 2018 Nov 1;125(5):1411-1423. doi: 10.1152/japplphysiol.01036.2017. Epub 2018 Aug 9. J Appl Physiol (1985). 2018. PMID: 30091664 Free PMC article.
-
Noninvasive assessment of alveolar microvascular recruitment in conscious non-sedated rats.Respir Physiol Neurobiol. 2014 Jan 1;190:105-12. doi: 10.1016/j.resp.2013.09.010. Epub 2013 Oct 4. Respir Physiol Neurobiol. 2014. PMID: 24100202 Free PMC article.
-
Surfactant protein A promotes western diet-induced hepatic steatosis and fibrosis in mice.Sci Rep. 2024 Mar 29;14(1):7464. doi: 10.1038/s41598-024-58291-5. Sci Rep. 2024. PMID: 38553537 Free PMC article.
-
Type II diabetes accentuates diaphragm blood flow increases during submaximal exercise in the rat.Respir Physiol Neurobiol. 2020 Oct;281:103518. doi: 10.1016/j.resp.2020.103518. Epub 2020 Aug 7. Respir Physiol Neurobiol. 2020. PMID: 32777269 Free PMC article.
-
Scientific evidence underlying contraindications to the ketogenic diet: An update.Obes Rev. 2020 Oct;21(10):e13053. doi: 10.1111/obr.13053. Epub 2020 Jul 10. Obes Rev. 2020. PMID: 32648647 Free PMC article. Review.
References
-
- Angermuller S, Fahimi HD. Imidazole-buffered osmium tetroxide: an excellent stain for visualization of lipids in transmission electron microscopy. Histochem J 14: 823–835, 1982 - PubMed
-
- Beers MF, Mulugeta S. Surfactant protein C biosynthesis and its emerging role in conformational lung disease. Annu Rev Physiol 67: 663–696, 2005 - PubMed
-
- Beers MF, Wali A, Eckenhoff MF, Feinstein SI, Fisher JH, Fisher AB. An antibody with specificity for surfactant protein C precursors: identification of pro-SP-C in rat lung. Am J Respir Cell Mol Biol 7: 368–378, 1992 - PubMed
-
- Boehme DS, Roberts CM, Bessman SP. High-performance liquid chromatographic analysis of lung phospholipids and their precursors in the offspring of diabetic rats. Biochem Med Metab Biol 44: 29–36, 1990 - PubMed
-
- Boulbou MS, Gourgoulianis KI, Krommydas GC, Klisiaris VK, Arseniou AA, Dafopoulos KC, Molyvdas PA. Diabetes mellitus vs. Raynaud disease: different lung vascular bed disorders. Arch Med Res 33: 531–535, 2002 - PubMed
Publication types
MeSH terms
Substances
Grants and funding
LinkOut - more resources
Full Text Sources
Medical