. 2010 Mar;298(3):H992-H1002.
doi: 10.1152/ajpheart.00958.2009. Epub 2010 Jan 8.

Triggering role of acid sphingomyelinase in endothelial lysosome-membrane fusion and dysfunction in coronary arteries

Affiliations

Triggering role of acid sphingomyelinase in endothelial lysosome-membrane fusion and dysfunction in coronary arteries

Jun-Xiang Bao et al. Am J Physiol Heart Circ Physiol. 2010 Mar.

Abstract

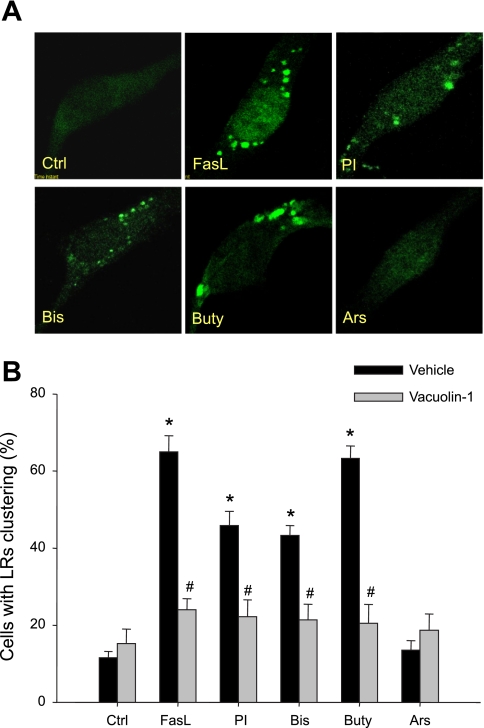
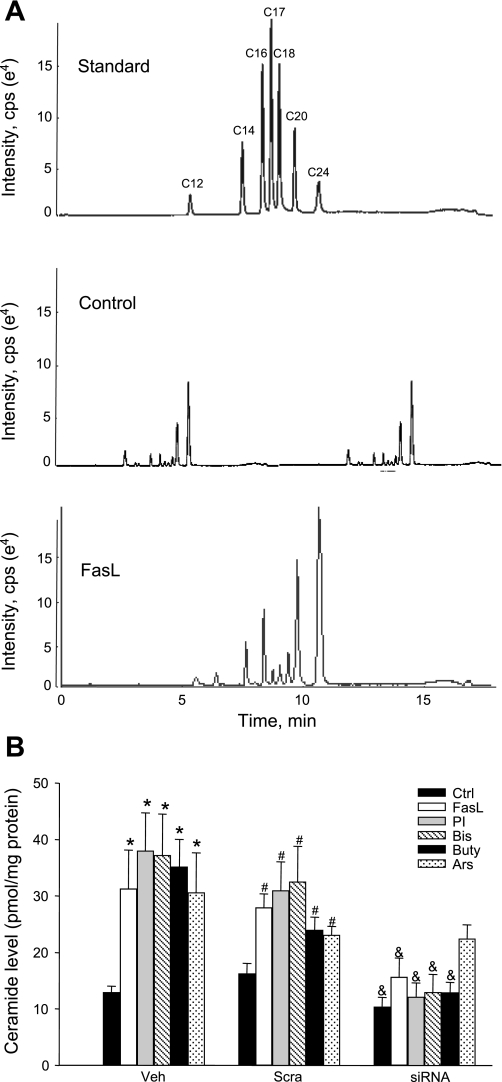
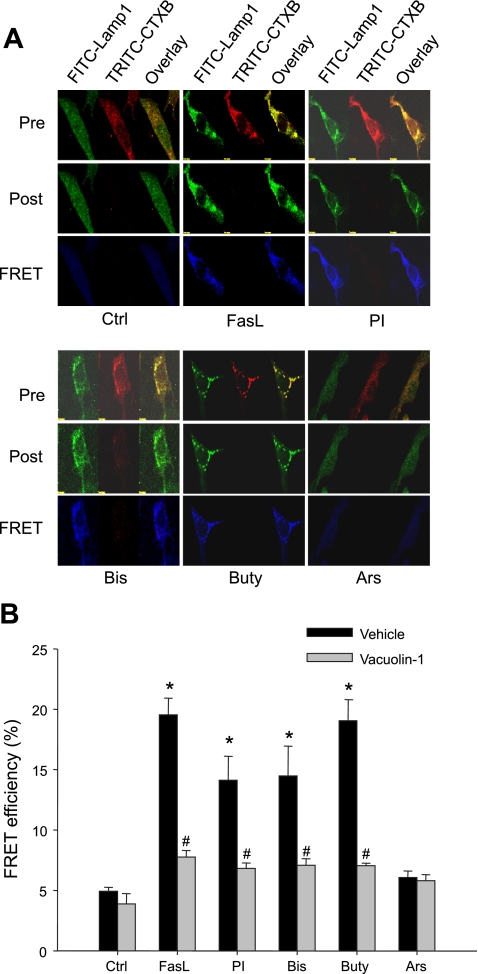
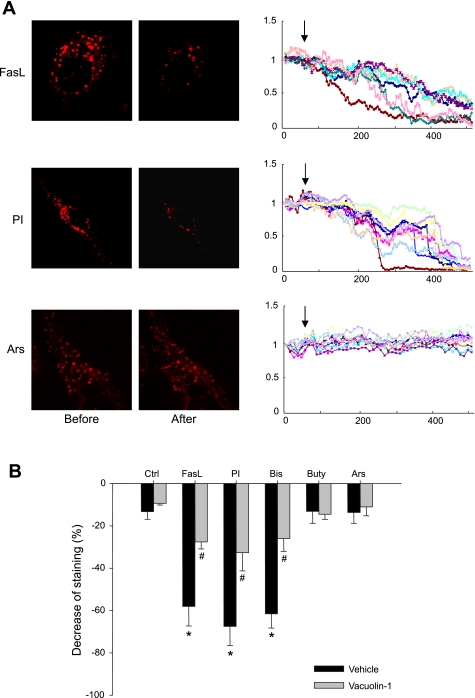
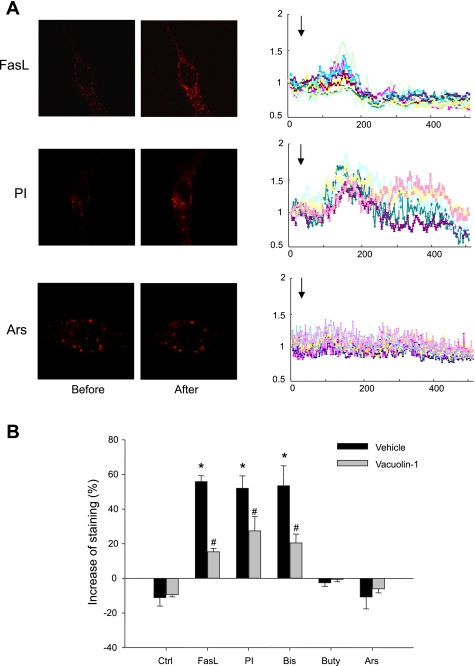
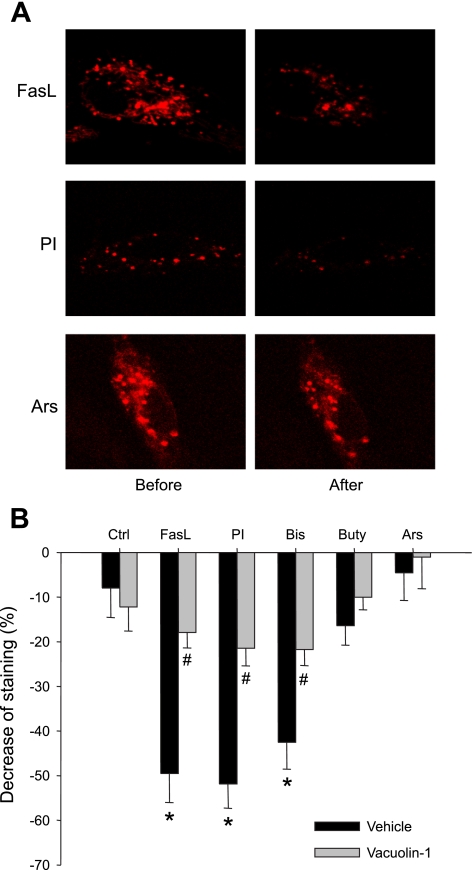
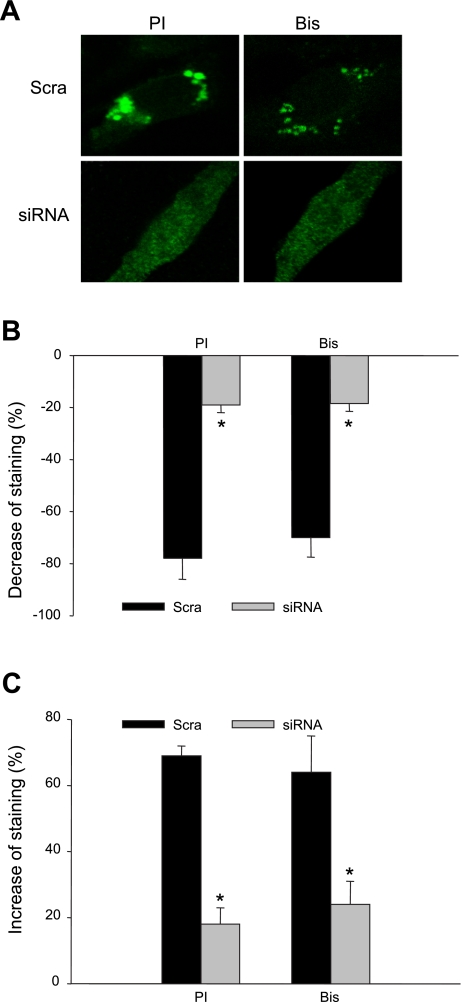
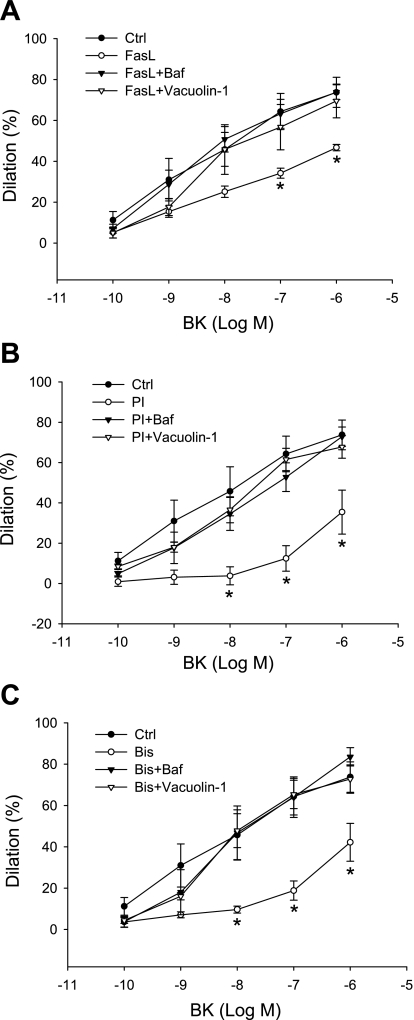
The present study determined whether activation of acid sphingomyelinase (ASM) drives membrane proximal lysosomes to fuse to the cell surface, facilitating membrane lipid rafts (LRs) clustering in coronary arterial endothelial cells (CAECs) and leading to endothelial dysfunction. By confocal microscopy, the activators of ASM, phosphatidylinositol (PI), and bis (monoacylglyceryl) phosphate (Bis), and an inducer of ASM, butyrate, were found to increase LRs clustering in bovine CAECs, which was blocked by lysosome fusion inhibitor vacuolin-1. However, arsenic trioxide (Ars), an inducer of de novo synthesis of ceramide, had no such effect. Similarly, vacuolin-1-blockable effects were observed using fluorescence resonance energy transfer detection. Liquid chromatography-electrospray ionization-tandem mass spectrometry analysis demonstrated that all of these treatments, even Ars, increased ceramide production in CAECs. When ASM gene was silenced, all treatments except Ars no longer increased ceramide levels. Furthermore, dynamic fluorescence monitoring in live cells showed that PI and Bis stimulated lysosome-membrane fusion in CAECs. Functionally, PI and Bis impaired endothelium-dependent vasodilation in perfused coronary arteries, which was blocked by vacuolin-1 and a lysosome function inhibitor, bafilomycine. FasL (Fas ligand), a previously confirmed lysosome fusion stimulator as a comparison, also produced a similar effect. It is concluded that ASM activation serves as a triggering mechanism and driving force, leading to fusion of membrane proximal lysosomes into LR clusters on the cell membrane of CAECs, which represents a novel mechanism mediating endothelial dysfunction during death receptor activation or other pathological situation.


Figures

Fig. 1.
Fig. 1.
A: representative images of lipid raft (LR) clustering in control (Ctrl) coronary artery endothelial cells (CAECs) and Fas ligand (FasL; 10 ng/ml for 15 min), phosphatidylinositol (PI; 5 μg/ml for 30 min), bis (monoacylglyceryl) phosphate (Bis; 1 μg/ml for 30 min), butyrate (Buty; 500 μM for 20 h), or arsenic trioxide (Ars; 1 μM for 20 h) stimulated cells. B: summarized results on percentage of cells with LR clustering in vehicle (Veh) or vacuolin-1 (10 μM for 1 h) pretreated group. Values are means ± SE; n = 7 batches of cells. *P < 0.05 vs. Ctrl group. #P < 0.05 vs. respective Veh group.
Fig. 2.
Fig. 2.
A: representative multiple reaction monitoring chromatography of ceramides separated by liquid chromatography-electrospray ionization-tandem mass spectrometry. cps, Counts per second. B: summarized results of ceramide production in Veh, scramble small RNA (sRNA) transfected (Scra) and acid sphingomyelinase (ASM) small interfering RNA (siRNA) transfected cells. Values are means ± SE; n = 8 experiments. *P < 0.05 vs. Ctrl in Veh-treated cells. #P < 0.05 vs. Ctrl in Scra cells. &P < 0.05 vs. Scra cells with the same treatments.
Fig. 3.
Fig. 3.
A: representative images of fluorescence resonance energy transfer (FRET) analysis between FITC-Lamp1 and tetramethylrhodamine isothiocyanate cholera toxin B (TRITC-CTXB) in CAECs. Pre and Post, pre- and postbleaching, respectively. B: summarized results of detected FRET efficiency between Lamp1 and CTXB in Veh or vacuolin-1 (10 μM for 1 h) pretreated cells. Values are means ± SE; n = 5 batches of cells. *P < 0.05 vs. Ctrl group. #P < 0.05 vs. respective Veh group.
Fig. 4.
Fig. 4.
Colocalization of Lamp1 and ASM (A) or ceramide (B) detected by confocal microscopy in intact and permeabilized CAECs. FITC-Lamp1 was shown as green fluorescence on the left; Texas red (TR)-ASM or ceramide shown red in the middle; and overlaid images are on the right. Yellow spots in overlaid images indicated colocalization of Lamp1 and ASM or ceramide.
Fig. 5.
Fig. 5.
A: representative images and traces before and after treatment with FasL, PI, and Ars in CAECs loaded with 8 μM FM1–43 and in the presence of 1 mM bromide phenol blue (BPB). The arrow shows the beginning of treatments. The fluorescence at 7 min after treatment was read for statistics. B: summarized results showing changes of FM1–43 fluorescence in Veh or vacuolin-1 (10 μM for 1 h) pretreated group, normalized by the fluorescence obtained before treatment. Values are means ± SE; n = 80 puncta from 5 batches of cells. *P < 0.05 vs. Ctrl group. #P < 0.05 vs. respective Veh group.
Fig. 6.
Fig. 6.
A: representative images and traces before and after treatment with FasL, PI, and Ars in CAECs loaded simultaneously with 8 μM FM1–43 and 1 mM BPB. The arrow shows the beginning of treatments. The highest level of fluorescence (2–3 min after treatment) was read for statistics. B: summarized results showing changes of FM1–43 fluorescence in Veh or vacuolin-1 (10 μM for 1 h) pretreated group, normalized by the fluorescence obtained before treatment. Values are means ± SE; n = 80 puncta from 5 batches of cells. *P < 0.05 vs. Ctrl group. #P < 0.05 vs. respective Veh group.
Fig. 7.
Fig. 7.
A: representative images before and after treatment with FasL, PI, and Ars in CAECs loaded with 100 μM FM2–10. The fluorescence at 7 min after treatment was read for statistics. B: summarized results showing changes of FM2–10 fluorescence in Veh or vacuolin-1 (10 μM for 1 h) pretreated group, normalized by the fluorescence obtained before treatment. Values are means ± SE; n = 80 puncta from 5 batches of cells. *P < 0.05 vs. Ctrl group. #P < 0.05 vs. respective Veh group.
Fig. 8.
Fig. 8.
A: representative images of LR clustering (A) induced by PI (5 μg/ml for 30 min) and Bis (1 μg/ml for 30 min) in Scra or ASM siRNA transfected cells. Summarized results showing quenching (B) and dequenching (C) of FM1–43 fluorescence in Scra- and siRNA-treated cell group. Values are means ± SE; n = 80 puncta from 5 batches of cells. *P < 0.05 vs. Scra group.
Fig. 9.
Fig. 9.
Impairment of endothelium-dependent vasodilator response to bradykinin (BK) induced by FasL (A), PI (B), and Bis (C) in small coronary arteries before and after application of bafilomycine (Baf; 100 nM for 20 min) and vacuolin-1 (10 μM for 1 h). Values are means ± SE; n = 5 cow hearts. *P < 0.05 vs. Ctrl group.

Similar articles

Cited by

References

    1. Allen JA, Halverson-Tamboli RA, Rasenick MM. Lipid raft microdomains and neurotransmitter signalling. Nat Rev Neurosci 8: 128–140, 2007 - PubMed
    1. Basanez G, Ruiz-Arguello MB, Alonso A, Goni FM, Karlsson G, Edwards K. Morphological changes induced by phospholipase C and by sphingomyelinase on large unilamellar vesicles: a cryo-transmission electron microscopy study of liposome fusion. Biophys J 72: 2630–2637, 1997 - PMC - PubMed
    1. Bollinger CR, Teichgraber V, Gulbins E. Ceramide-enriched membrane domains. Biochim Biophys Acta 1746: 284–294, 2005 - PubMed
    1. Brandin L, Bergstrom G, Manhem K, Gustafsson H. Oestrogen modulates vascular adrenergic reactivity of the spontaneously hypertensive rat. J Hypertens 21: 1695–1702, 2003 - PubMed
    1. Bund SJ, Lee RM. Arterial structural changes in hypertension: a consideration of methodology, terminology and functional consequence. J Vasc Res 40: 547–557, 2003 - PubMed

Publication types

MeSH terms