

AT_CHLORO, a comprehensive chloroplast proteome database with subplastidial localization and curated information on envelope proteins
- PMID: 20061580
- PMCID: PMC2877971
- DOI: 10.1074/mcp.M900325-MCP200
AT_CHLORO, a comprehensive chloroplast proteome database with subplastidial localization and curated information on envelope proteins
Abstract
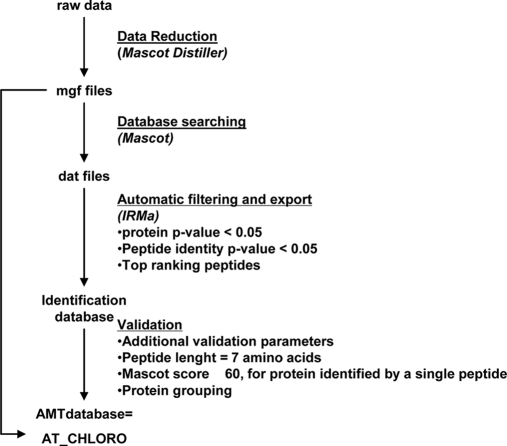
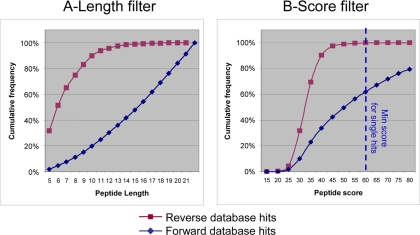
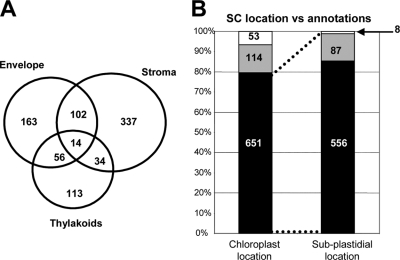
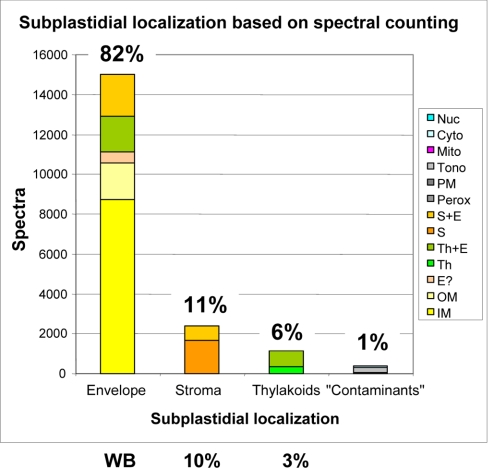
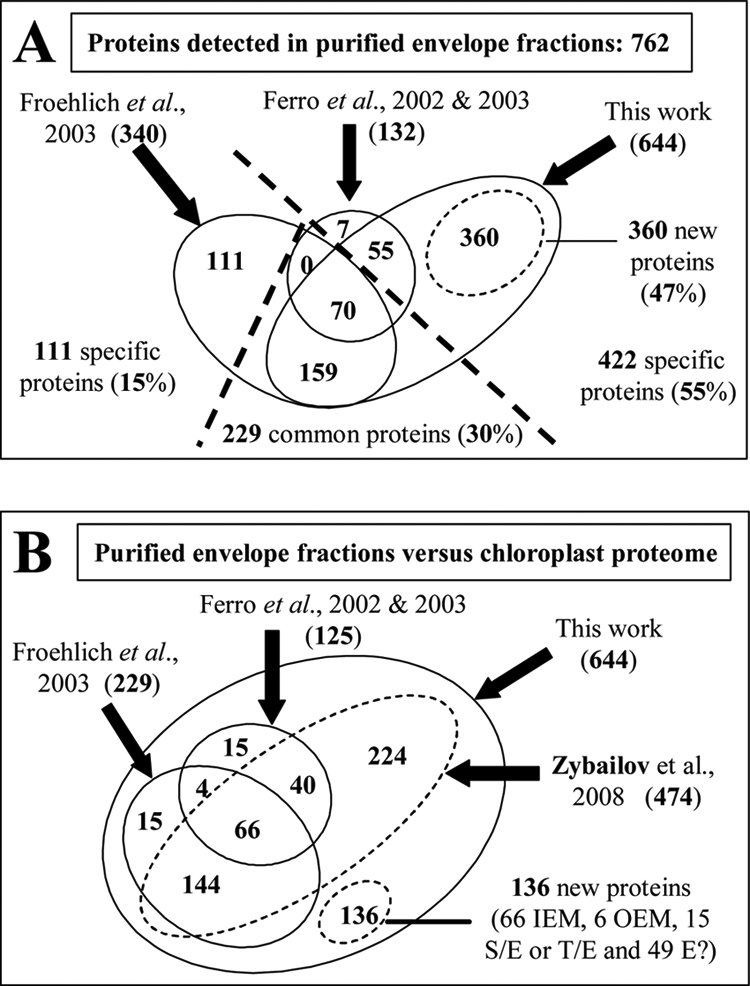
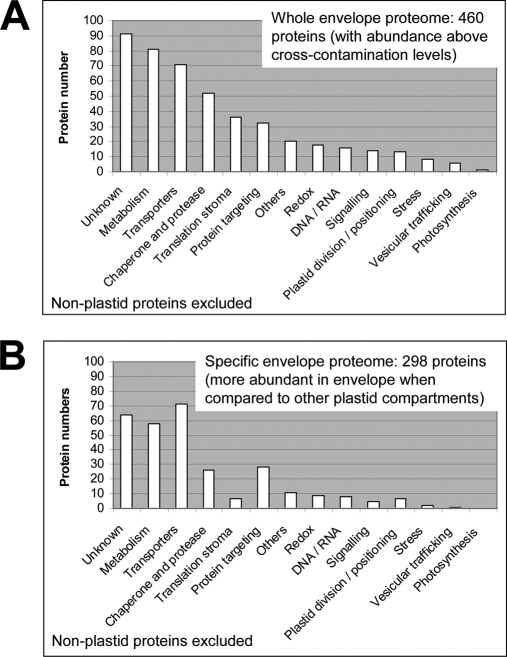
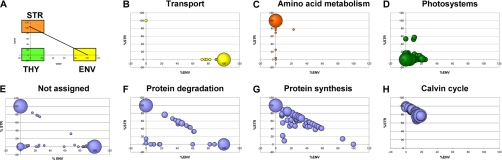
Recent advances in the proteomics field have allowed a series of high throughput experiments to be conducted on chloroplast samples, and the data are available in several public databases. However, the accurate localization of many chloroplast proteins often remains hypothetical. This is especially true for envelope proteins. We went a step further into the knowledge of the chloroplast proteome by focusing, in the same set of experiments, on the localization of proteins in the stroma, the thylakoids, and envelope membranes. LC-MS/MS-based analyses first allowed building the AT_CHLORO database (http://www.grenoble.prabi.fr/protehome/grenoble-plant-proteomics/), a comprehensive repertoire of the 1323 proteins, identified by 10,654 unique peptide sequences, present in highly purified chloroplasts and their subfractions prepared from Arabidopsis thaliana leaves. This database also provides extensive proteomics information (peptide sequences and molecular weight, chromatographic retention times, MS/MS spectra, and spectral count) for a unique chloroplast protein accurate mass and time tag database gathering identified peptides with their respective and precise analytical coordinates, molecular weight, and retention time. We assessed the partitioning of each protein in the three chloroplast compartments by using a semiquantitative proteomics approach (spectral count). These data together with an in-depth investigation of the literature were compiled to provide accurate subplastidial localization of previously known and newly identified proteins. A unique knowledge base containing extensive information on the proteins identified in envelope fractions was thus obtained, allowing new insights into this membrane system to be revealed. Altogether, the data we obtained provide unexpected information about plastidial or subplastidial localization of some proteins that were not suspected to be associated to this membrane system. The spectral counting-based strategy was further validated as the compartmentation of well known pathways (for instance, photosynthesis and amino acid, fatty acid, or glycerolipid biosynthesis) within chloroplasts could be dissected. It also allowed revisiting the compartmentation of the chloroplast metabolism and functions.
Figures

Similar articles
-
Chloroplast proteomics highlights the subcellular compartmentation of lipid metabolism.Prog Lipid Res. 2010 Apr;49(2):128-58. doi: 10.1016/j.plipres.2009.10.003. Epub 2009 Oct 30. Prog Lipid Res. 2010. PMID: 19879895 Review.
-
Chloroplast proteomics and the compartmentation of plastidial isoprenoid biosynthetic pathways.Mol Plant. 2009 Nov;2(6):1154-80. doi: 10.1093/mp/ssp088. Epub 2009 Nov 12. Mol Plant. 2009. PMID: 19969518 Review.
-
AT_CHLORO: The First Step When Looking for Information About Subplastidial Localization of Proteins.Methods Mol Biol. 2018;1829:395-406. doi: 10.1007/978-1-4939-8654-5_26. Methods Mol Biol. 2018. PMID: 29987736
-
Unraveling Hidden Components of the Chloroplast Envelope Proteome: Opportunities and Limits of Better MS Sensitivity.Mol Cell Proteomics. 2019 Jul;18(7):1285-1306. doi: 10.1074/mcp.RA118.000988. Epub 2019 Apr 8. Mol Cell Proteomics. 2019. PMID: 30962257 Free PMC article.
-
Preparation of Chloroplast Sub-compartments from Arabidopsis for the Analysis of Protein Localization by Immunoblotting or Proteomics.J Vis Exp. 2018 Oct 19;(140):58581. doi: 10.3791/58581. J Vis Exp. 2018. PMID: 30394394 Free PMC article.
Cited by
-
Comparative proteomics of chloroplasts envelopes from bundle sheath and mesophyll chloroplasts reveals novel membrane proteins with a possible role in c4-related metabolite fluxes and development.Front Plant Sci. 2013 Mar 28;4:65. doi: 10.3389/fpls.2013.00065. eCollection 2013. Front Plant Sci. 2013. PMID: 23543921 Free PMC article.
-
Metabolism and Signaling of Plant Mitochondria in Adaptation to Environmental Stresses.Int J Mol Sci. 2022 Sep 23;23(19):11176. doi: 10.3390/ijms231911176. Int J Mol Sci. 2022. PMID: 36232478 Free PMC article. Review.
-
Plant ABC Transporters.Arabidopsis Book. 2011;9:e0153. doi: 10.1199/tab.0153. Epub 2011 Dec 6. Arabidopsis Book. 2011. PMID: 22303277 Free PMC article.
-
Two isoforms of Arabidopsis protoporphyrinogen oxidase localize in different plastidal membranes.Plant Physiol. 2023 May 31;192(2):871-885. doi: 10.1093/plphys/kiad107. Plant Physiol. 2023. PMID: 36806676 Free PMC article.
-
Reduced expression of the proteolytically inactive FtsH members has impacts on the Darwinian fitness of Arabidopsis thaliana.J Exp Bot. 2019 Apr 12;70(7):2173-2184. doi: 10.1093/jxb/erz004. J Exp Bot. 2019. PMID: 30721974 Free PMC article.
References
-
- Jarvis P. (2008) Targeting of nucleus-encoded proteins to chloroplasts in plants. New Phytol 179, 257–285 - PubMed
-
- Joyard J., Block M., Pineau B., Albrieux C., Douce R. (1990) Envelope membranes from mature spinach chloroplasts contain a NADPH:protochlorophyllide reductase on the cytosolic side of the outer membrane. J. Biol. Chem 265, 21820–21827 - PubMed
-
- Lilley K. S., Dupree P. (2007) Plant organelle proteomics. Curr. Opin. Plant Biol 10, 594–599 - PubMed
-
- Haynes P. A., Roberts T. H. (2007) Subcellular shotgun proteomics in plants: looking beyond the usual suspects. Proteomics 7, 2963–2975 - PubMed
-
- Rossignol M., Peltier J. B., Mock H. P., Matros A., Maldonado A. M., Jorrín J. V. (2006) Plant proteome analysis: a 2004–2006 update. Proteomics 6, 5529–5548 - PubMed
Publication types
MeSH terms
Substances
LinkOut - more resources
Full Text Sources
Other Literature Sources
Molecular Biology Databases
