

N-acetylcysteine prevents 4-hydroxynonenal- and amyloid-beta-induced modification and inactivation of neprilysin in SH-SY5Y cells
- PMID: 20061637
- PMCID: PMC4246496
- DOI: 10.3233/JAD-2010-1226
N-acetylcysteine prevents 4-hydroxynonenal- and amyloid-beta-induced modification and inactivation of neprilysin in SH-SY5Y cells
Abstract
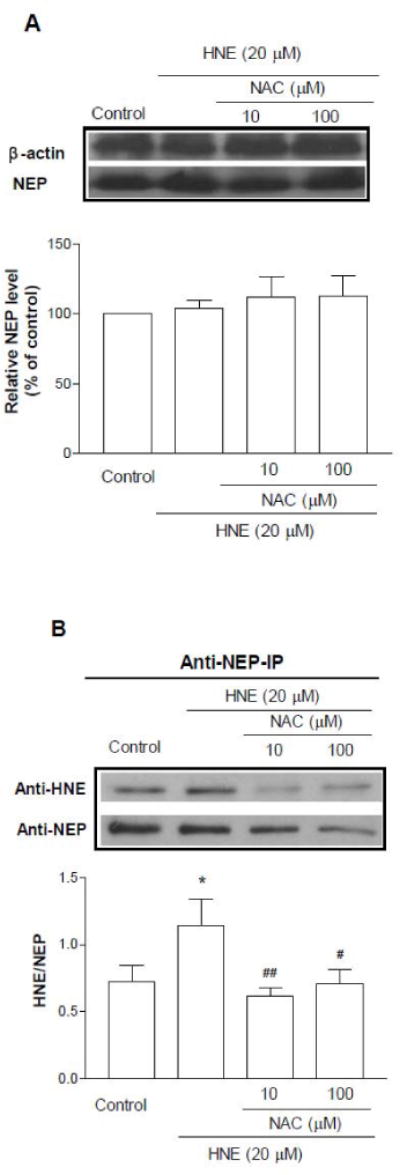
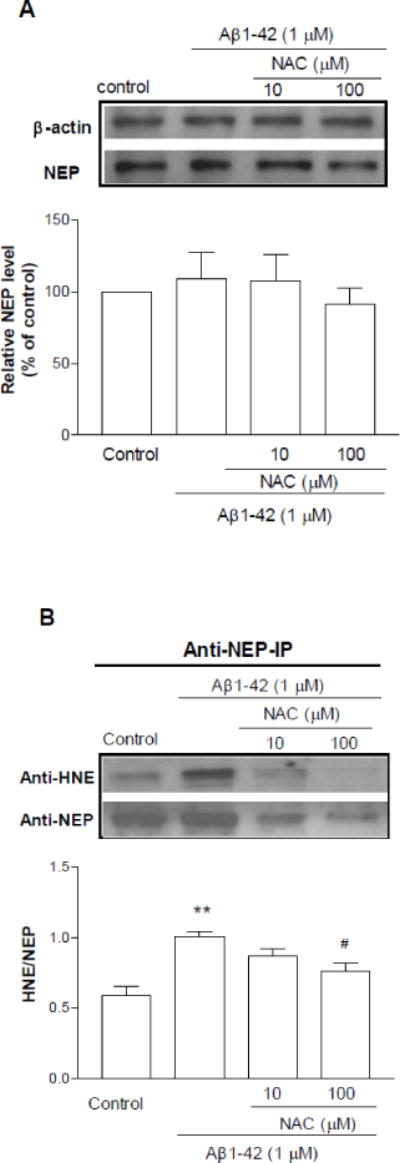
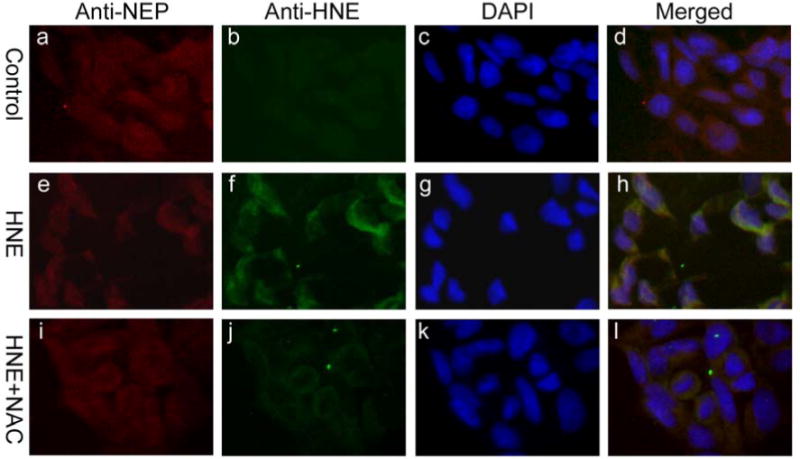
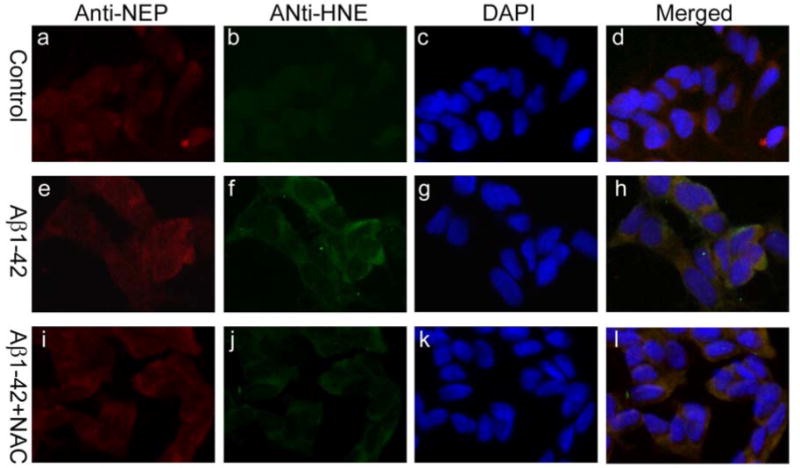
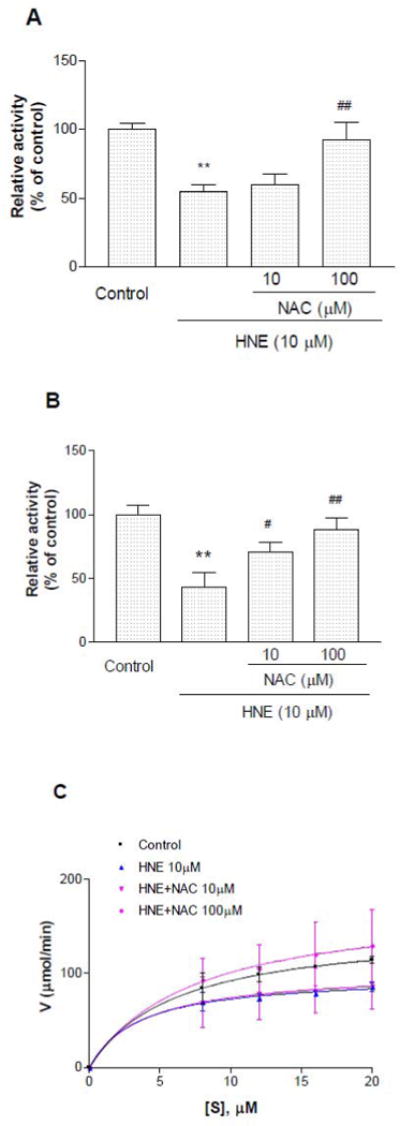
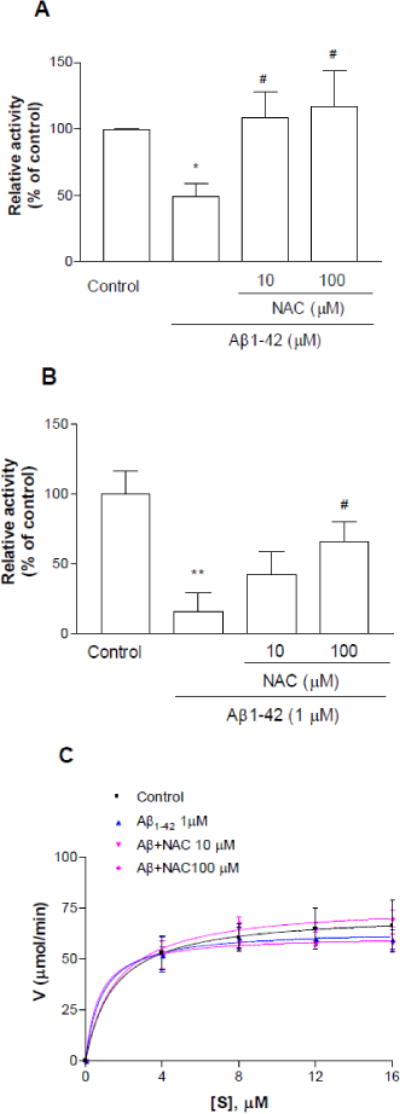
As one of the dominant amyloid-beta peptide (Abeta) proteases, neprilysin (NEP) plays a crucial role in maintaining a physiologic balance between Abeta production and catabolism. We have previously shown that NEP is modified by 4-hydroxynonenal (HNE) adducts, resulting in decreased activity in the brain of AD patients and cultured cells. In order to determine whether antioxidants can rescue NEP, SH-SY5Y cells were treated with HNE or Abeta, together with N-acetylcysteine for 24 hours, prior to analysis of NEP protein levels, activity, and oxidative modifications. Intracellular NEP developed HNE adducts after 24 hours of HNE or Abeta treatment as determined by immunoprecipitation, immunoblotting, and double immunofluorescence staining. N-acetylcysteine at 10 to 100 microM alleviated HNE adduction after HNE or Abeta treatment. In keeping with previous reports, HNE-modified NEP showed decreased catalytic activity. The present study demonstrates that antioxidants can be used to spare NEP from oxidative modification, suggesting a potential mechanism underlying the neuroprotective effects of antioxidants in aging or Alzheimer's disease.
Figures
Similar articles
-
The antioxidant xanthorrhizol prevents amyloid-β-induced oxidative modification and inactivation of neprilysin.Biosci Rep. 2018 Feb 2;38(1):BSR20171611. doi: 10.1042/BSR20171611. Print 2018 Feb 28. Biosci Rep. 2018. PMID: 29330223 Free PMC article.
-
Effects of HNE-modification induced by Abeta on neprilysin expression and activity in SH-SY5Y cells.J Neurochem. 2009 Feb;108(4):1072-82. doi: 10.1111/j.1471-4159.2008.05855.x. J Neurochem. 2009. PMID: 19196432 Free PMC article.
-
Oxidized neprilysin in aging and Alzheimer's disease brains.Biochem Biophys Res Commun. 2003 Oct 10;310(1):236-41. doi: 10.1016/j.bbrc.2003.09.003. Biochem Biophys Res Commun. 2003. PMID: 14511676
-
Beta-amyloid catabolism: roles for neprilysin (NEP) and other metallopeptidases?J Neurochem. 2002 Apr;81(1):1-8. doi: 10.1046/j.1471-4159.2002.00855.x. J Neurochem. 2002. PMID: 12067222 Review.
-
Impact of Insulin Degrading Enzyme and Neprilysin in Alzheimer's Disease Biology: Characterization of Putative Cognates for Therapeutic Applications.J Alzheimers Dis. 2015;48(4):891-917. doi: 10.3233/JAD-150379. J Alzheimers Dis. 2015. PMID: 26444774 Review.
Cited by
-
HIV-1 reduces Abeta-degrading enzymatic activities in primary human mononuclear phagocytes.J Immunol. 2011 Jun 15;186(12):6925-32. doi: 10.4049/jimmunol.1100211. Epub 2011 May 6. J Immunol. 2011. PMID: 21551363 Free PMC article.
-
Inhibition of tissue transglutaminase promotes Aβ-induced apoptosis in SH-SY5Y cells.Acta Pharmacol Sin. 2016 Dec;37(12):1534-1542. doi: 10.1038/aps.2016.95. Epub 2016 Sep 26. Acta Pharmacol Sin. 2016. PMID: 27665848 Free PMC article.
-
The antioxidant xanthorrhizol prevents amyloid-β-induced oxidative modification and inactivation of neprilysin.Biosci Rep. 2018 Feb 2;38(1):BSR20171611. doi: 10.1042/BSR20171611. Print 2018 Feb 28. Biosci Rep. 2018. PMID: 29330223 Free PMC article.
-
Effect of N-Acetyl Cysteine as an Adjuvant Treatment in Alzheimer's Disease.Brain Sci. 2025 Feb 7;15(2):164. doi: 10.3390/brainsci15020164. Brain Sci. 2025. PMID: 40002497 Free PMC article. Review.
-
Distinct subcellular patterns of neprilysin protein and activity in the brains of Alzheimer's disease patients, transgenic mice and cultured human neuronal cells.Am J Transl Res. 2013 Sep 25;5(6):608-21. eCollection 2013. Am J Transl Res. 2013. PMID: 24093058 Free PMC article.
References
-
- Areosa SA, Sherriff F. Memantine for dementia. Cochrane Database Syst Rev. 2003:CD003154. - PubMed
-
- Selkoe DJ. Alzheimer’s disease: genes, proteins, and therapy. Physiol Rev. 2001;81:741–766. - PubMed
-
- Hardy J, Selkoe DJ. The amyloid hypothesis of Alzheimer’s disease: progress and problems on the road to therapeutics. Science. 2002;297:353–356. - PubMed
Publication types
MeSH terms
Substances
Grants and funding
LinkOut - more resources
Full Text Sources
Other Literature Sources
Research Materials
