
Common variants at 2q37.3, 8q24.21, 15q21.3 and 16q24.1 influence chronic lymphocytic leukemia risk

Dalemari Crowther-Swanepoel et al. Nat Genet. 2010 Feb.

Abstract

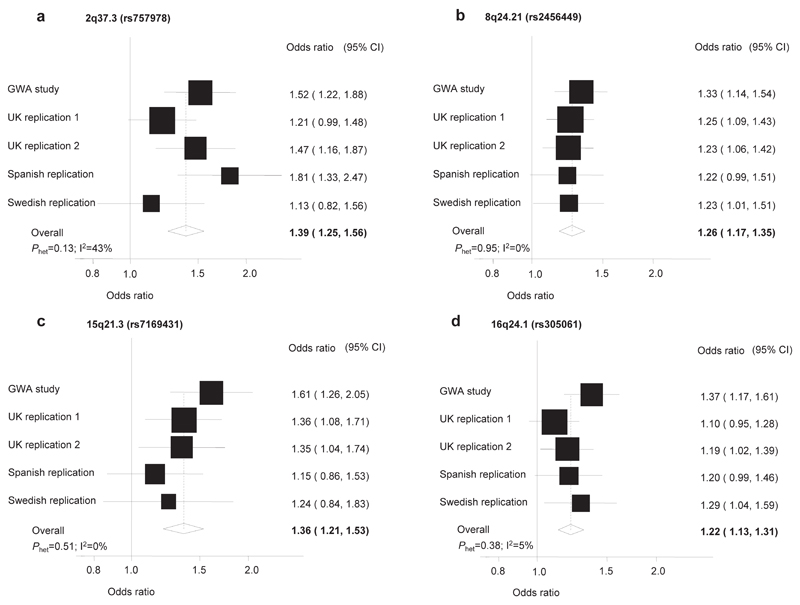
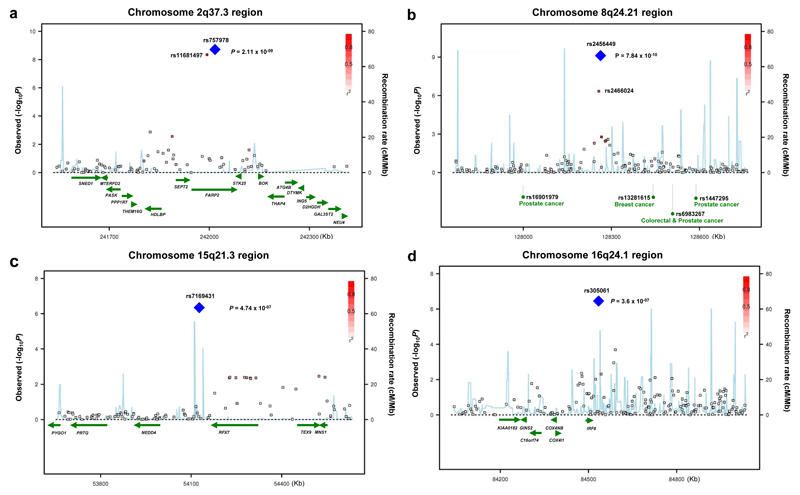
To identify new risk variants for chronic lymphocytic leukemia (CLL), we conducted a genome-wide association study of 299,983 tagging SNPs, with validation in four additional series totaling 2,503 cases and 5,789 controls. We identified four new risk loci for CLL at 2q37.3 (rs757978, FARP2; odds ratio (OR) = 1.39; P = 2.11 x 10(-9)), 8q24.21 (rs2456449; OR = 1.26; P = 7.84 x 10(-10)), 15q21.3 (rs7169431; OR = 1.36; P = 4.74 x 10(-7)) and 16q24.1 (rs305061; OR = 1.22; P = 3.60 x 10(-7)). We also found evidence for risk loci at 15q25.2 (rs783540, CPEB1; OR = 1.18; P = 3.67 x 10(-6)) and 18q21.1 (rs1036935; OR = 1.22; P = 2.28 x 10(-6)). These data provide further evidence for genetic susceptibility to this B-cell hematological malignancy.


Conflict of interest statement

Competing Interests Statement

The authors declare no competing financial interests.

Figures

Figure 1
Figure 1. Forest plots of effect size and direction for the SNPs associated with CLL risk. (a) 2q37.3 (rs757978), (b) 8q24.21 (rs2456449), (c) 15q21.3 (rs7169431), (d) 16q24.1 (rs305061).
Boxes denote OR point estimates, their areas being proportional to the inverse variance weight of the estimate. Horizontal lines represent 95% confidence intervals. The diamond (and broken line) represents the summary OR computed under a fixed effects model, with 95% confidence interval given by the width of the diamond. The unbroken vertical line is at the null value (OR = 1.0).
Figure 2
Figure 2. Four previously unidentified loci, 2q37.3, 8q24.21, 15q21.3, and 16q24.1 showing genome-wide level of evidence of association to CLL.
(a) Illustration of the 2q37.3 locus, with the local recombination rate plotted in light blue over this 600-kb chromosomal segment centered on rs757978. Each square represents a SNP found in this locus and the most associated SNP in the combined analysis, rs757978, is marked by a blue diamond. The color intensity of each square reflects the extent of LD with rs757978 - red (r2 > 0.8) through to white (r2 < 0.3). Physical positions are based on build 36 of the human genome. rs757978 is located in exon 9 of FARP2. (b) Illustration of the 8q24.21 locus, with the most associated SNP in this locus, rs2456449, highlighted by a blue diamond. Here, we also present all SNPs found within a 600-kb window centered on rs2456449 and define SNP colors based on LD with rs2456449. (c) Illustration of the 15q21.3 locus, with the most associated SNP in this locus, rs7169431, highlighted by a blue diamond. Here, we also present all SNPs found within a 600-kb window centered on rs7169431 and define SNP colors based on LD with rs7169431. NEDD4 and RFXDC2 map centromeric and telomeric to rs7169431. (d) Illustration of the 16q24.1 locus, with the most associated SNP in this locus, rs305061, highlighted by a blue diamond. Here, we also present all SNPs found within a 600-kb window centered on rs305061 and define SNP colors based on LD with rs305061. In this case, IRF8 is the only gene found in the vicinity to the association signal. Linkage disequilibrium maps are presented for all four loci in Supplementary Figure 1a–d online.
Figure 3
Figure 3. Cumulative impact of the 10 variants on CLL risk.
(a) Distribution of risk alleles in controls (blue bars) and CLL cases (red bars) for the 10 loci (rs757978, rs2456449, rs7169431 and rs305061 and the six previously identified loci - rs17483466, rs13397985, rs872071, rs735665, rs7176508, and rs11083846); (b) Plot of the increasing ORs for CLL with increasing number of risk alleles. The ORs are relative to the median number of 7 risk alleles; Vertical bars correspond to 95% confidence intervals. The distribution of risk alleles follows a normal distribution in both case and controls, with a shift towards a higher number of risk alleles in cases. Analysis is based on data from Stages 1, 2 and UK-replication series 2. Horizontal line denotes the null value (OR=1.0).

Similar articles

  • Inherited genetic susceptibility to monoclonal B-cell lymphocytosis.
    Crowther-Swanepoel D, Corre T, Lloyd A, Gaidano G, Olver B, Bennett FL, Doughty C, Toniolo D, Caligaris-Cappio F, Ghia P, Rossi D, Rawstron AC, Catovsky D, Houlston RS. Crowther-Swanepoel D, et al. Blood. 2010 Dec 23;116(26):5957-60. doi: 10.1182/blood-2010-07-294975. Epub 2010 Sep 20. Blood. 2010. PMID: 20855867
  • A genome-wide association study identifies six susceptibility loci for chronic lymphocytic leukemia.
    Di Bernardo MC, Crowther-Swanepoel D, Broderick P, Webb E, Sellick G, Wild R, Sullivan K, Vijayakrishnan J, Wang Y, Pittman AM, Sunter NJ, Hall AG, Dyer MJ, Matutes E, Dearden C, Mainou-Fowler T, Jackson GH, Summerfield G, Harris RJ, Pettitt AR, Hillmen P, Allsup DJ, Bailey JR, Pratt G, Pepper C, Fegan C, Allan JM, Catovsky D, Houlston RS. Di Bernardo MC, et al. Nat Genet. 2008 Oct;40(10):1204-10. doi: 10.1038/ng.219. Epub 2008 Aug 31. Nat Genet. 2008. PMID: 18758461
  • Common genetic variation at 15q25.2 impacts on chronic lymphocytic leukaemia risk.
    Crowther-Swanepoel D, Di Bernardo MC, Jamroziak K, Karabon L, Frydecka I, Deaglio S, D'Arena G, Rossi D, Gaidano G, Olver B, Lloyd A, Broderick P, Laurenti L, Szemraj-Rogucka Z, Robak T, Catovsky D, Houlston RS. Crowther-Swanepoel D, et al. Br J Haematol. 2011 Jul;154(2):229-33. doi: 10.1111/j.1365-2141.2011.08706.x. Epub 2011 May 9. Br J Haematol. 2011. PMID: 21554262
  • Genetic variation and risk of chronic lymphocytic leukaemia.
    Crowther-Swanepoel D, Houlston RS. Crowther-Swanepoel D, et al. Semin Cancer Biol. 2010 Dec;20(6):363-9. doi: 10.1016/j.semcancer.2010.08.006. Epub 2010 Sep 15. Semin Cancer Biol. 2010. PMID: 20833250 Review.
  • Genetic susceptibility to chronic lymphocytic leukemia.
    Slager SL, Caporaso NE, de Sanjose S, Goldin LR. Slager SL, et al. Semin Hematol. 2013 Oct;50(4):296-302. doi: 10.1053/j.seminhematol.2013.09.007. Semin Hematol. 2013. PMID: 24246697 Free PMC article. Review.

Cited by

References

    1. Goldin LR, Pfeiffer RM, Li X, Hemminki K. Familial risk of lymphoproliferative tumors in families of patients with chronic lymphocytic leukemia: results from the Swedish Family-Cancer Database. Blood. 2004;104:1850–4. - PubMed
    1. Di Bernardo MC, et al. A genome-wide association study identifies six susceptibility loci for chronic lymphocytic leukemia. Nat Genet. 2008;40:1204–10. - PubMed
    1. Gunnarsson R, et al. Screening for copy-number alterations and loss of heterozygosity in chronic lymphocytic leukemia--a comparative study of four differently designed, high resolution microarray platforms. Genes Chromosomes Cancer. 2008;47:697–711. - PubMed
    1. Ferreira BI, et al. Comparative genome profiling across subtypes of low-grade B-cell lymphoma identifies type-specific and common aberrations that target genes with a role in B-cell neoplasia. Haematologica. 2008;93:670–9. - PubMed
    1. Grubor V, et al. Novel genomic alterations and clonal evolution in chronic lymphocytic leukemia revealed by representational oligonucleotide microarray analysis (ROMA) Blood. 2009;113:1294–303. - PubMed

Publication types

MeSH terms