

Characteristics of motor resonance predict the pattern of flash-lag effects for biological motion
- PMID: 20062543
- PMCID: PMC2798616
- DOI: 10.1371/journal.pone.0008258
Characteristics of motor resonance predict the pattern of flash-lag effects for biological motion
Abstract
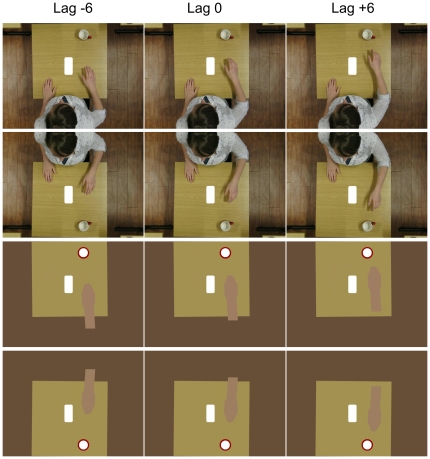
Background: When a moving stimulus and a briefly flashed static stimulus are physically aligned in space the static stimulus is perceived as lagging behind the moving stimulus. This vastly replicated phenomenon is known as the Flash-Lag Effect (FLE). For the first time we employed biological motion as the moving stimulus, which is important for two reasons. Firstly, biological motion is processed by visual as well as somatosensory brain areas, which makes it a prime candidate for elucidating the interplay between the two systems with respect to the FLE. Secondly, discussions about the mechanisms of the FLE tend to recur to evolutionary arguments, while most studies employ highly artificial stimuli with constant velocities.
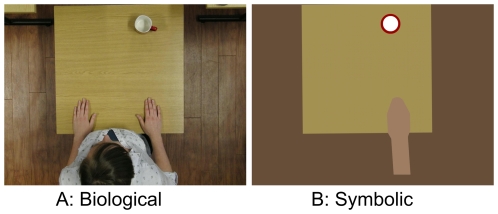
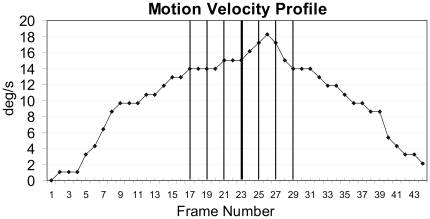
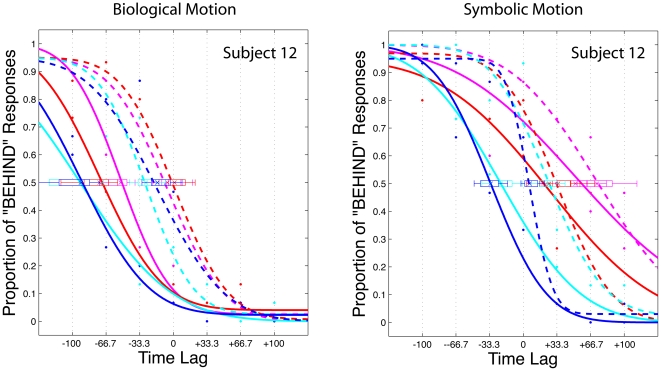
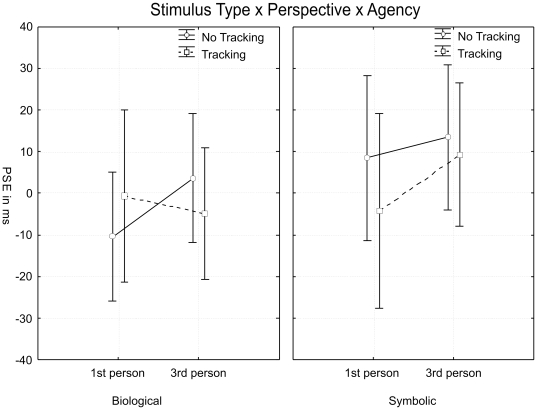
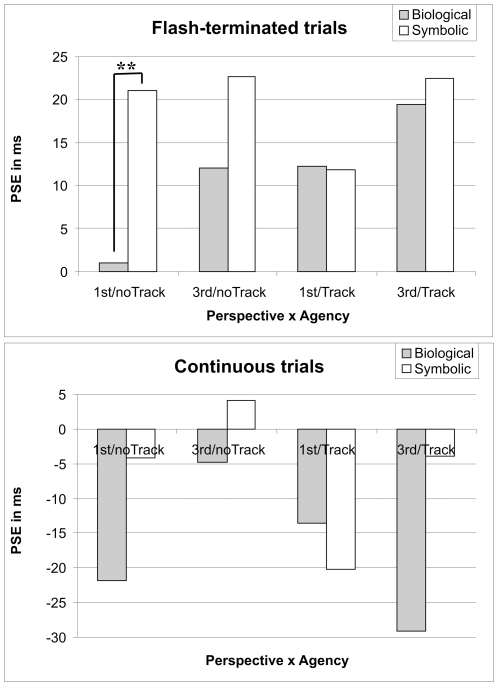
Methodology/principal finding: Since biological motion is ecologically valid it follows complex patterns with changing velocity. We therefore compared biological to symbolic motion with the same acceleration profile. Our results with 16 observers revealed a qualitatively different pattern for biological compared to symbolic motion and this pattern was predicted by the characteristics of motor resonance: The amount of anticipatory processing of perceived actions based on the induced perspective and agency modulated the FLE.
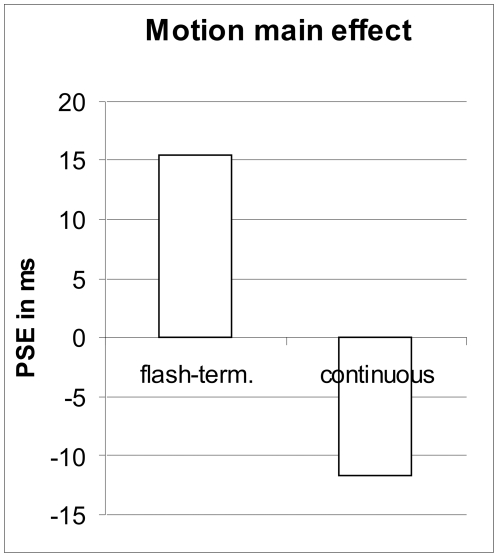
Conclusions/significance: Our study provides first evidence for an FLE with non-linear motion in general and with biological motion in particular. Our results suggest that predictive coding within the sensorimotor system alone cannot explain the FLE. Our findings are compatible with visual prediction (Nijhawan, 2008) which assumes that extrapolated motion representations within the visual system generate the FLE. These representations are modulated by sudden visual input (e.g. offset signals) or by input from other systems (e.g. sensorimotor) that can boost or attenuate overshooting representations in accordance with biased neural competition (Desimone & Duncan, 1995).
Conflict of interest statement
Figures
Similar articles
-
Neural latencies do not explain the auditory and audio-visual flash-lag effect.Vision Res. 2005 Nov;45(23):2917-25. doi: 10.1016/j.visres.2004.09.020. Vision Res. 2005. PMID: 16115662
-
Motion extrapolation in the flash-lag effect depends on perceived, rather than physical speed.Vision Res. 2022 Apr;193:107978. doi: 10.1016/j.visres.2021.107978. Epub 2021 Dec 20. Vision Res. 2022. PMID: 34942429
-
Stopping the motion and sleuthing the flash-lag effect: spatial uncertainty is the key to perceptual mislocalization.Vision Res. 2004;44(22):2605-19. doi: 10.1016/j.visres.2003.10.028. Vision Res. 2004. PMID: 15358076
-
Motion Extrapolation in Visual Processing: Lessons from 25 Years of Flash-Lag Debate.J Neurosci. 2020 Jul 22;40(30):5698-5705. doi: 10.1523/JNEUROSCI.0275-20.2020. J Neurosci. 2020. PMID: 32699152 Free PMC article. Review.
-
Temporal facilitation for moving stimuli is independent of changes in direction.Vision Res. 2000;40(28):3829-39. doi: 10.1016/s0042-6989(00)00225-x. Vision Res. 2000. PMID: 11090675 Review.
Cited by
-
The haptic and the visual flash-lag effect and the role of flash characteristics.PLoS One. 2018 Jan 3;13(1):e0189291. doi: 10.1371/journal.pone.0189291. eCollection 2018. PLoS One. 2018. PMID: 29298309 Free PMC article.
-
Does Area V3A Predict Positions of Moving Objects?Front Psychol. 2010 Nov 12;1:186. doi: 10.3389/fpsyg.2010.00186. eCollection 2010. Front Psychol. 2010. PMID: 21897824 Free PMC article.
-
Cues to intention bias action perception toward the most efficient trajectory.Sci Rep. 2019 Apr 18;9(1):6472. doi: 10.1038/s41598-019-42204-y. Sci Rep. 2019. PMID: 30996227 Free PMC article.
References
-
- Nijhawan R. Motion extrapolation in catching. Nature. 1994;370:256–257. - PubMed
-
- Nijhawan R. Visual prediction: psychophysics and neurophysiology of compensation for time delays. Behav Brain Sci. 2008;31:179–198; discussion 198–239. - PubMed
-
- Desimone R, Duncan J. Neural mechanisms of selective visual attention. Annu Rev Neurosci. 1995;18:193–222. - PubMed
-
- Maus GW, Nijhawan R. Going, going, gone: localizing abrupt offsets of moving objects. J Exp Psychol Hum Percept Perform. 2009;35:611–626. - PubMed
Publication types
MeSH terms
Grants and funding
LinkOut - more resources
Full Text Sources
