

Genetic structure among 50 species of the northeastern Pacific rocky intertidal community
- PMID: 20062807
- PMCID: PMC2799524
- DOI: 10.1371/journal.pone.0008594
Genetic structure among 50 species of the northeastern Pacific rocky intertidal community
Abstract
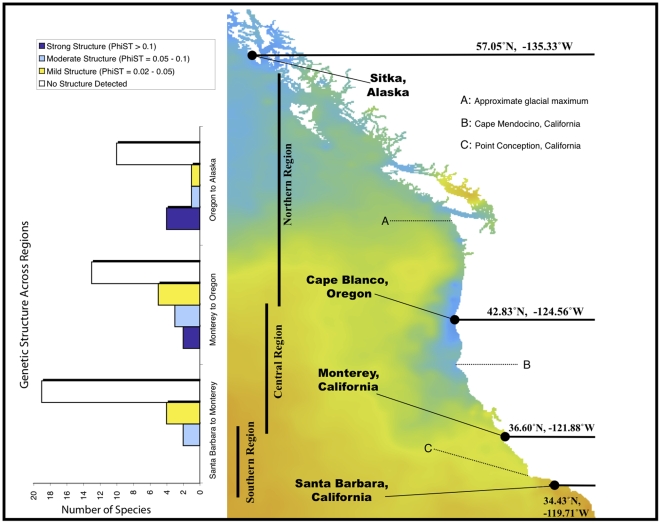
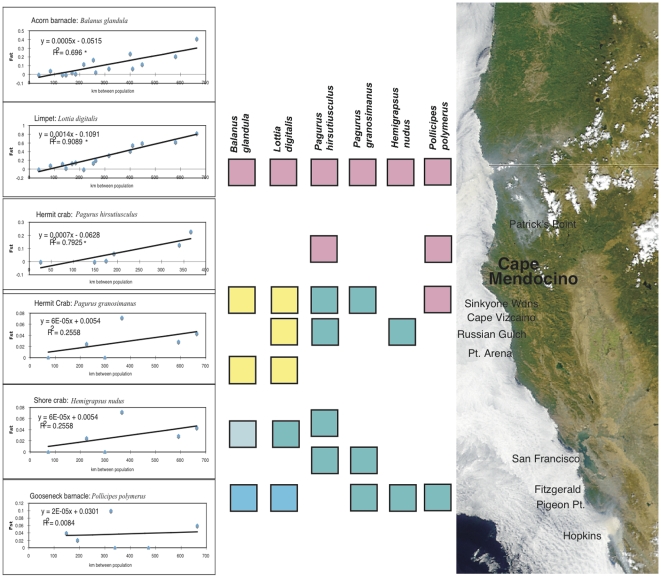
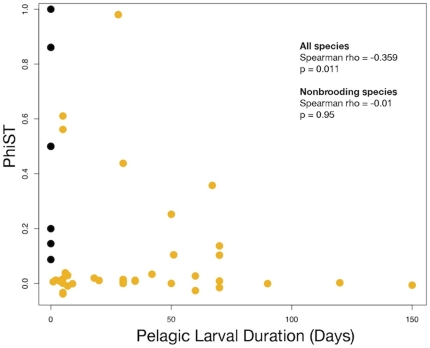
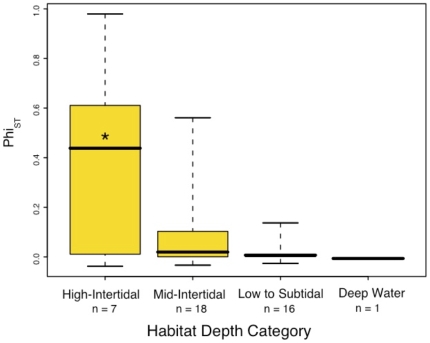
Comparing many species' population genetic patterns across the same seascape can identify species with different levels of structure, and suggest hypotheses about the processes that cause such variation for species in the same ecosystem. This comparative approach helps focus on geographic barriers and selective or demographic processes that define genetic connectivity on an ecosystem scale, the understanding of which is particularly important for large-scale management efforts. Moreover, a multispecies dataset has great statistical advantages over single-species studies, lending explanatory power in an effort to uncover the mechanisms driving population structure. Here, we analyze a 50-species dataset of Pacific nearshore invertebrates with the aim of discovering the most influential structuring factors along the Pacific coast of North America. We collected cytochrome c oxidase I (COI) mtDNA data from populations of 34 species of marine invertebrates sampled coarsely at four coastal locations in California, Oregon, and Alaska, and added published data from 16 additional species. All nine species with non-pelagic development have strong genetic structure. For the 41 species with pelagic development, 13 show significant genetic differentiation, nine of which show striking FST levels of 0.1-0.6. Finer scale geographic investigations show unexpected regional patterns of genetic change near Cape Mendocino in northern California for five of the six species tested. The region between Oregon and Alaska is a second focus of intraspecific genetic change, showing differentiation in half the species tested. Across regions, strong genetic subdivision occurs more often than expected in mid-to-high intertidal species, a result that may reflect reduced gene flow due to natural selection along coastal environmental gradients. Finally, the results highlight the importance of making primary research accessible to policymakers, as unexpected barriers to marine dispersal break the coast into separate demographic zones that may require their own management plans.
Conflict of interest statement
Figures
Similar articles
-
Hydroids (Cnidaria, Hydrozoa) from Mauritanian Coral Mounds.Zootaxa. 2020 Nov 16;4878(3):zootaxa.4878.3.2. doi: 10.11646/zootaxa.4878.3.2. Zootaxa. 2020. PMID: 33311142
-
Strong genetic clines and geographical variation in gene flow in the rocky intertidal barnacle Balanus glandula.Mol Ecol. 2004 Aug;13(8):2143-56. doi: 10.1111/j.1365-294X.2004.02225.x. Mol Ecol. 2004. PMID: 15245390
-
Role of oceanography in shaping the genetic structure in the North Pacific hake Merluccius productus.PLoS One. 2018 Mar 26;13(3):e0194646. doi: 10.1371/journal.pone.0194646. eCollection 2018. PLoS One. 2018. PMID: 29579060 Free PMC article.
-
Using eDNA to Supplement Population Genetic Analyses for Cryptic Marine Species: Identifying Population Boundaries for Alaska Harbour Porpoises.Mol Ecol. 2025 Mar;34(5):e17563. doi: 10.1111/mec.17563. Epub 2024 Oct 25. Mol Ecol. 2025. PMID: 39450613 Free PMC article.
-
Patterns of mtDNA diversity in northwestern North America.Hum Biol. 2004 Feb;76(1):33-54. doi: 10.1353/hub.2004.0023. Hum Biol. 2004. PMID: 15222679 Review.
Cited by
-
Mitochondrial DNA reveals genetic structuring of Pinna nobilis across the Mediterranean Sea.PLoS One. 2013 Jun 28;8(6):e67372. doi: 10.1371/journal.pone.0067372. Print 2013. PLoS One. 2013. PMID: 23840684 Free PMC article.
-
Evaluating the boundaries of marine biogeographic regions of the Southwestern Atlantic using halacarid mites (Halacaridae), meiobenthic organisms with a low dispersal potential.Ecol Evol. 2019 Nov 7;9(23):13359-13374. doi: 10.1002/ece3.5791. eCollection 2019 Dec. Ecol Evol. 2019. PMID: 31871650 Free PMC article.
-
Phylogeographic structure in benthic marine invertebrates of the southeast Pacific coast of Chile with differing dispersal potential.PLoS One. 2014 Feb 19;9(2):e88613. doi: 10.1371/journal.pone.0088613. eCollection 2014. PLoS One. 2014. PMID: 24586356 Free PMC article.
-
Drivers of Cape Verde archipelagic endemism in keyhole limpets.Sci Rep. 2017 Feb 2;7:41817. doi: 10.1038/srep41817. Sci Rep. 2017. PMID: 28150720 Free PMC article.
-
Patterns and Variation in Benthic Biodiversity in a Large Marine Ecosystem.PLoS One. 2015 Aug 26;10(8):e0135135. doi: 10.1371/journal.pone.0135135. eCollection 2015. PLoS One. 2015. PMID: 26308521 Free PMC article.
References
-
- Lubchenco J, Palumbi S, Gaines S, Andelman S. Plugging a hole in the ocean: The emerging science of marine reserves. Ecological Applications. 2003;13:S3–S7.
-
- Moritz C. Defining ‘evolutionary significant units’ for conservation. Trends in Ecology and Evolution. 1994;9:373–375. - PubMed
-
- Slocombe S. Implementing Ecosystem-Based Management. BioScience. 1993;43:612–622.
-
- Pikitch EK, Santora C, Babcock EA, Bakun A, Bonfil R, et al. Ecosystem-Based Fishery Management. Science. 2004;305:346–347. - PubMed
Publication types
MeSH terms
Substances
LinkOut - more resources
Full Text Sources
Miscellaneous
