. 2010 Apr;67(7):1119-32.
doi: 10.1007/s00018-009-0250-9.

Glucocorticoids suppress cystathionine gamma-lyase expression and H2S production in lipopolysaccharide-treated macrophages

Affiliations

Glucocorticoids suppress cystathionine gamma-lyase expression and H2S production in lipopolysaccharide-treated macrophages

Xiao-Yan Zhu et al. Cell Mol Life Sci. 2010 Apr.

Abstract

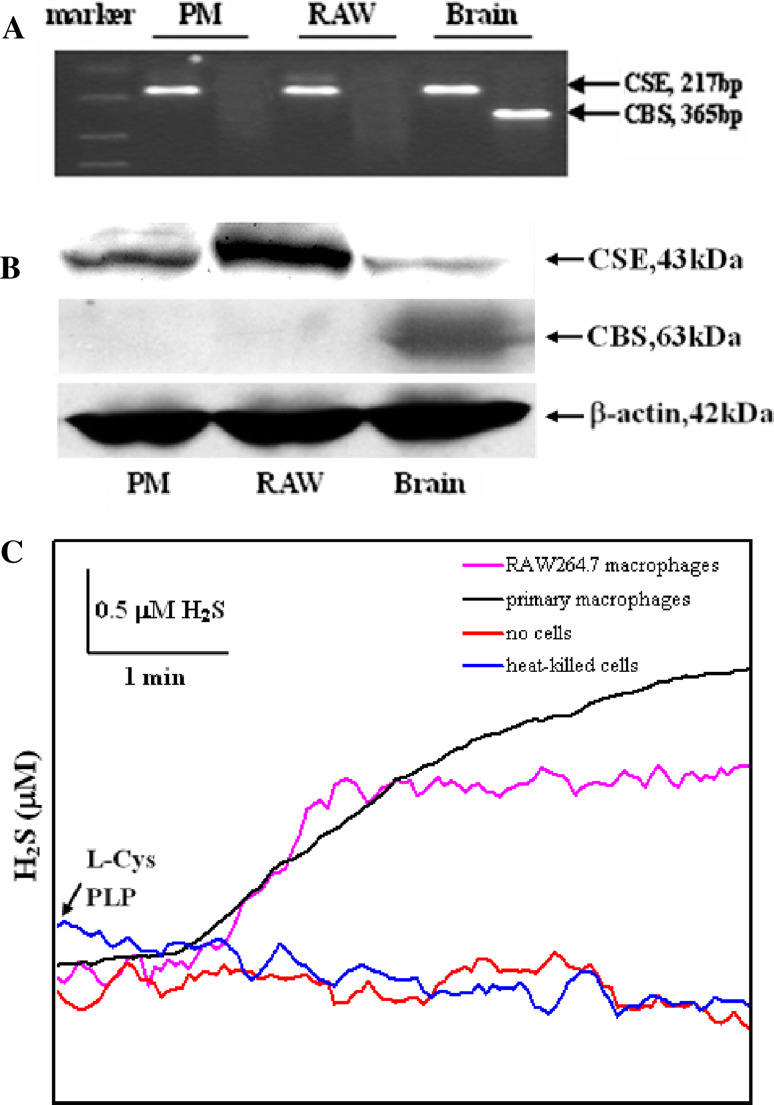
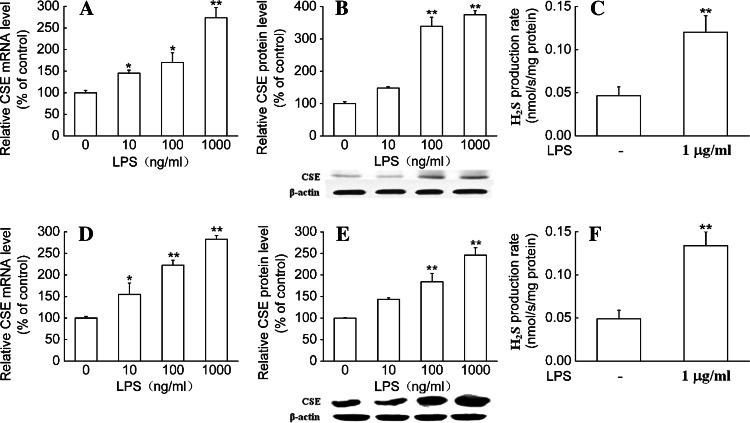
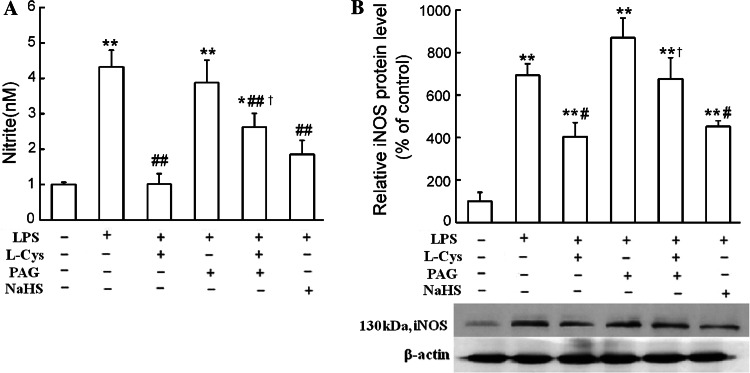
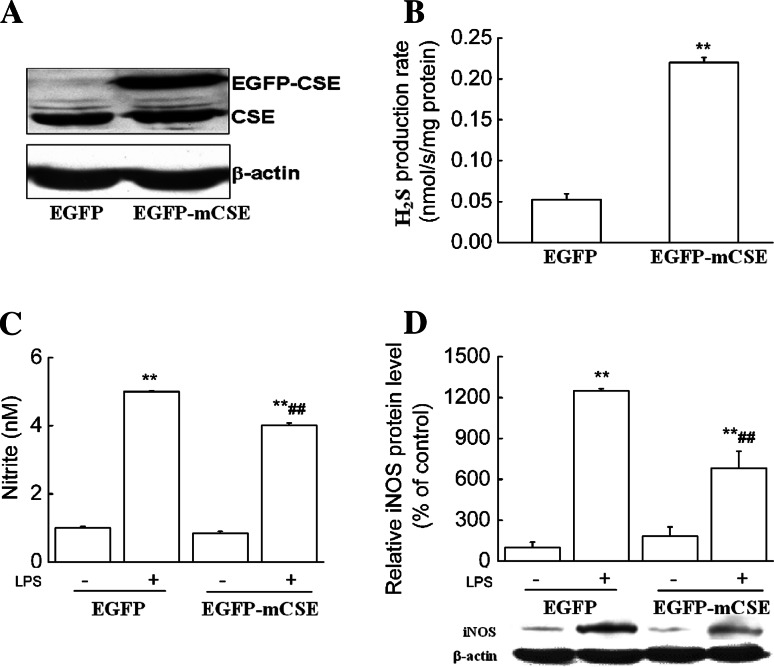
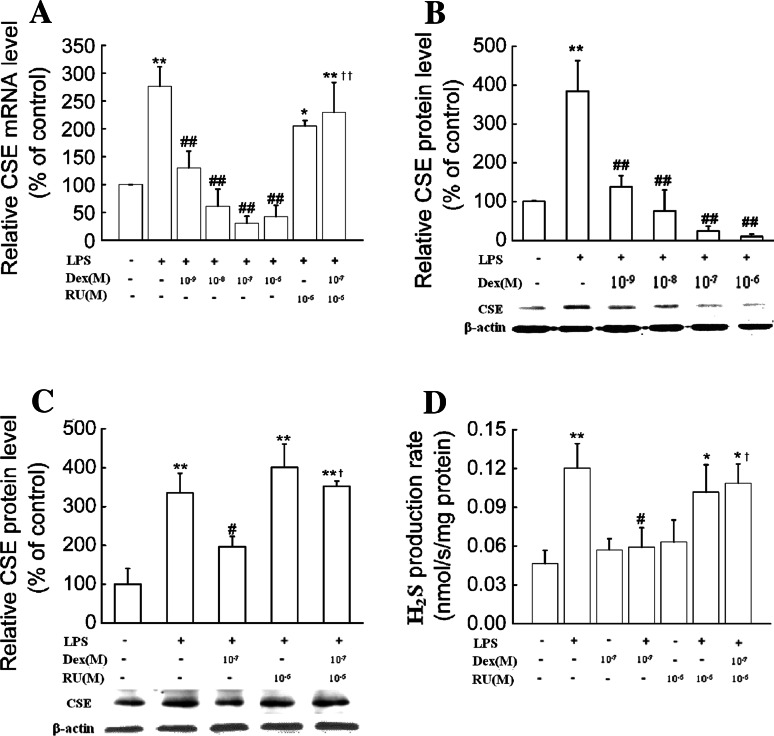
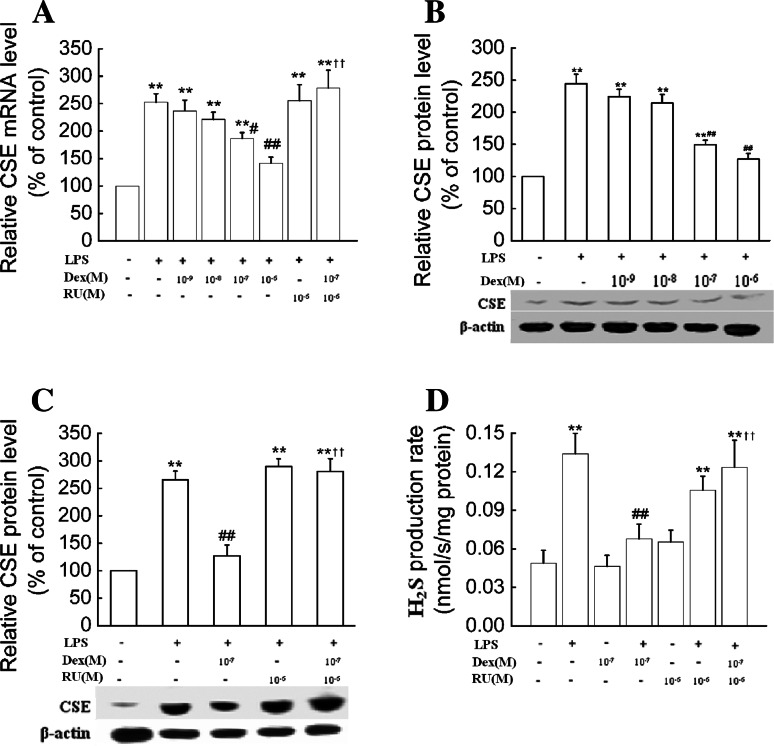
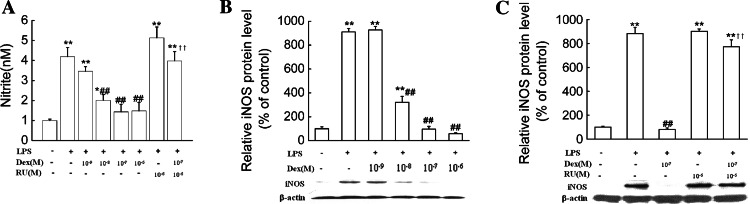
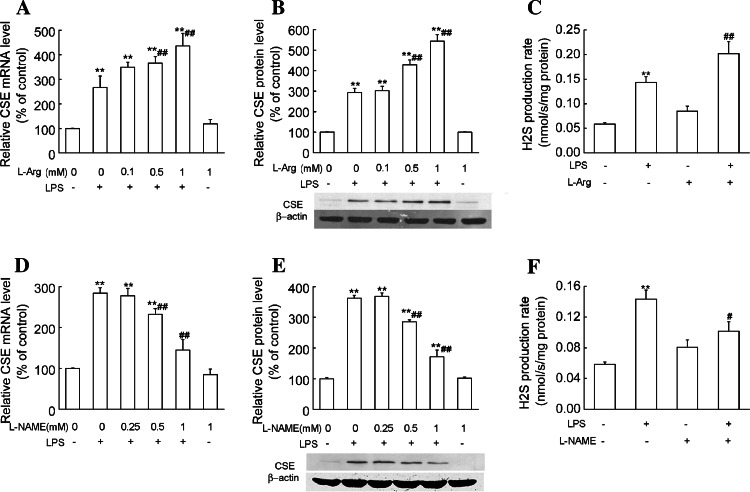
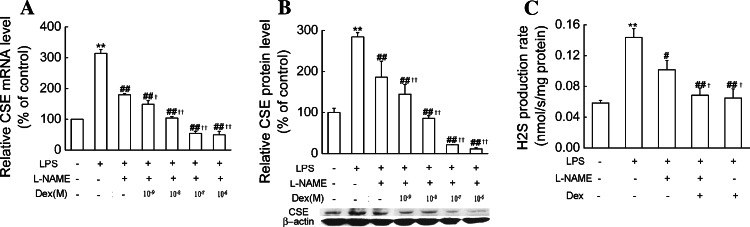
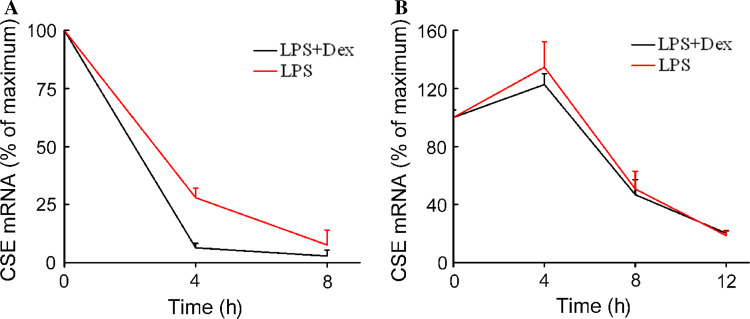
Hydrogen sulfide (H(2)S) plays an important role in inflammation. We showed that macrophages expressed the H(2)S-forming enzyme cystathionine gamma-lyase (CSE) and produced H(2)S. Lipopolysaccharide (LPS) stimulated the CSE expression and H(2)S production rate. l-cysteine reduced LPS-induced nitric oxide (NO) production. CSE inhibitor blocked the inhibitory effect of l-cysteine. CSE knockdown increased, whereas CSE overexpression decreased LPS-induced NO production. Dexamethasone suppressed LPS-induced CSE expression and the H(2)S production rate as well as NO production. l-arginine increased, whereas N(G)-nitro-l-arginine methyl ester (l-NAME) decreased LPS-induced CSE expression and H(2)S production. Dexamethasone plus l-NAME significantly decreased LPS-induced CSE expression and H(2)S production compared to l-NAME. Our results suggest that macrophages are one of the H(2)S producing sources. H(2)S might exert anti-inflammatory effects by inhibiting NO production. Dexamethasone may directly inhibit CSE expression and H(2)S production, besides the NO-dependent way. Inhibition of H(2)S and NO production may be a mechanism by which glucocorticoids coordinate the balance between pro- and anti-inflammatory mediators during inflammation.


Figures

Fig. 1
Fig. 1
Expression of H2S synthetic enzymes and H2S synthetic activity in macrophages. a PCR analysis of CSE and CBS mRNA in macrophages and brain. b Western blot analysis showing protein expression of CSE and CBS in macrophages and brain. c Representative traces of H2S production in suspensions of primary and RAW 264.7 macrophages. H2S production was initiated by the addition of l-cysteine and PLP. There were two control traces of buffered solutions without cells or with heat-killed cells containing l-cysteine and PLP, indicating no spontaneous H2S production. PM primary peritoneal macrophages, RAW RAW 264.7 macrophages, l -Cys l-cysteine
Fig. 2
Fig. 2
LPS increased CSE expression and H2S synthetic activity in macrophages. Primary (ac) and RAW 264.7 (df) macrophages were stimulated with LPS at the indicated doses for 6 h (a, d) or 24 h (b, c, e, f), respectively. Quantitative real-time RT-PCR, Western blot analysis and real-time H2S production measurement were used to determine CSE mRNA expression, protein expression and H2S synthetic activity in macrophages. Results of Western blot were quantified by scanning densitometry of blots. H2S production rates were calculated as described in “Materials and Methods.” Data were expressed as mean percentage of control ± SEM for CSE mRNA and protein expression (n = 3), and for H2S production rates (n = 4). *P < 0.05; **P < 0.01 compared with vehicle control
Fig. 3
Fig. 3
H2S inhibited NO production and iNOS expression in LPS-stimulated macrophages. Primary macrophages were treated with 1 mmol/l l-cysteine, 1 mmol/l PAG, or 200 μmol/l NaHS for 24 h in the absence or presence of LPS (1 μg/ml). NO production (a) and iNOS protein expression (b) were determined as described in “Materials and Methods.” Data were expressed as mean ± SEM for NO production (n = 4) and mean percentage of control ± SEM for iNOS protein expression (n = 3). *P < 0.05; **P < 0.01 compared with vehicle control; #P < 0.05; ##P < 0.01 compared with LPS; †P < 0.05 compared with LPS plus l-Cys. l -Cys l-cysteine
Fig. 4
Fig. 4
CSE siRNA increased LPS-induced NO production and iNOS expression. RAW264.7 macrophages were separately transfected with pRNAT-U6.1/Neo-mCSE and pRNAT-U6.1/Neo-Control vectors. Stable CSE-knockdown RAW264.7 cells were selected and maintained in medium containing G418 and named “RAW-mCSE siRNA” (“RAW-control siRNA” as control). Western blot analysis (a) and real-time H2S production measurement (b) were used to determine CSE protein expression and H2S synthetic activity in CSE-knockdown RAW264.7 cells. After stimulation with LPS (1 μg/ml) for 24 h, NO production (c) and iNOS protein expression (d) were determined as described in “Materials and Methods.” Data were expressed as mean ± SEM for H2S production rates (n = 3) and NO production (n = 4), and mean percentage of control ± SEM for iNOS protein expression (n = 3). *P < 0.05; **P < 0.01 compared with “RAW-control siRNA”; ##P < 0.01 compared with “RAW-control siRNA” stimulated with LPS. Control siRNA: RAW-control siRNA; mCSE siRNA: RAW-mCSE siRNA
Fig. 5
Fig. 5
CSE overexpression decreased LPS-induced NO production and iNOS expression. RAW264.7 macrophages were separately transfected with pEGFP-N3 and pEGFP-mCSE vectors. Stable CSE-overexpression RAW264.7 cells were selected and maintained in medium containing G418 and named “RAW-EGFP-mCSE” (“RAW-EGFP” as control). Western blot analysis (a) and real-time H2S production measurement (b) were used to determine CSE protein expression and H2S synthetic activity in CSE-overexpression RAW264.7 cells. After stimulation with LPS (1 μg/ml) for 24 h, NO production (c) and iNOS protein expression (d) were determined as described in “Materials and Methods.” Data were expressed as mean ± SEM for H2S production rates (n = 3) and NO production (n = 4), and mean percentage of control ± SEM for iNOS protein expression (n = 3). **P < 0.01 compared with “RAW-EGFP”; ##P < 0.01 compared with “RAW-EGFP” stimulated with LPS. EGFP: RAW-EGFP; EGFP-mCSE: RAW-EGFP-mCSE
Fig. 6
Fig. 6
Dexamethasone suppressed CSE expression and H2S production in primary macrophages. Primary macrophages were treated with dexamethasone at the indicated doses in the absence or presence of RU38,486 (10−6 mol/l) and LPS (1 μg/ml) for 6 h (a) or 24 h (b–d). CSE mRNA (a), protein expression (b, c) as well as H2S production rates (d) were determined as described in “Materials and Methods.” Data were presented as mean percentage of control ± SEM for ac (n = 3) and mean ± SEM for H2S production rates (n = 4). *P < 0.05, ** P < 0.01 compared with control; #P < 0.05, ##P < 0.01 compared with LPS; †P < 0.05, ††P < 0.01 compared with LPS plus dexamethasone. Dex dexamethasone, RU RU38,486
Fig. 7
Fig. 7
Dexamethasone suppressed CSE expression and H2S production in RAW264.7 macrophages. RAW264.7 macrophages were treated with dexamethasone at the indicated doses in the absence or presence of RU38,486 (10−6 mol/l) and LPS (1 μg/ml) for 6 h (a) or 24 h (bd). CSE mRNA (a), protein expression (b, c) as well as H2S production rates (d) were determined as described in “Materials and Methods.” Data were presented as mean percentage of control ± SEM for ac (n = 3) and mean ± SEM for H2S production rates (n = 4). **P < 0.01 compared with control; #P < 0.05, ##P < 0.01 compared with LPS; ††P < 0.01 compared with LPS plus dexamethasone. Dex dexamethasone, RU RU38,486
Fig. 8
Fig. 8
Dexamethasone suppressed NO production and iNOS expression in primary macrophages. Primary macrophages were treated with dexamethasone at the indicated doses in the absence or presence of RU38,486 (10−6 mol/l) and LPS (1 μg/ml) for 24 h. NO production (a) and iNOS expression (b, c) were determined as described in “Materials and Methods.” Data were presented as mean ± SEM for NO production (n = 4) and mean percentage of control ± SEM for iNOS expression (n = 3). *P < 0.05; **P < 0.01 compared with control; ##P < 0.01 compared with LPS; ††P < 0.01 compared with LPS plus dexamethasone. Dex dexamethasone, RU RU38,486
Fig. 9
Fig. 9
Effects of NO precursor and NOS inhibitor on CSE expression and H2S production in primary macrophages stimulated with LPS. Primary macrophages were treated with NO precursor l-arginine (ac) or NOS inhibitor l-NAME (df) at the indicated doses in the absence or presence of LPS (1 μg/ml) for 6 h (a, d) or 24 h (b, c, e, f), respectively. Quantitative real-time RT-PCR, Western blot analysis and real-time H2S production measurement were used to determine CSE mRNA expression, protein expression and H2S synthetic activity in macrophages. Results of Western blot were quantified by scanning densitometry of blots. H2S production rates were calculated as described in “Materials and Methods.” Data were expressed as mean percentage of control ± SEM for CSE mRNA and protein expression (n = 3), and for H2S production rates (n = 4). **P < 0.01 compared with vehicle control. #P < 0.05, ##P < 0.01 compared with LPS. l -arg l-arginine
Fig. 10
Fig. 10
Effects of dexamethasone on LPS-induced CSE expression and H2S production in the presence of NOS inhibitor in primary macrophages. Primary macrophages were treated with dexamethasone at the indicated doses in the absence or presence of l-NAME (1 mmol/l) and LPS (1 μg/ml) for 6 h (a) or 24 h (bc). CSE mRNA (a), protein expression (b) as well as H2S production rates (c) were determined as described in “Materials and Methods.” Data were presented as mean percentage of control ± SEM for ab (n = 3) and mean ± SEM for H2S production rates (n = 4). **P < 0.01 compared with control; #P < 0.05, ##P < 0.01 compared with LPS; †P < 0.05, ††P < 0.01 compared with LPS plus l-NAME. Dex dexamethasone
Fig. 11
Fig. 11
Effects of dexamethasone on CSE mRNA stability in macrophages stimulated with LPS. Primary (a) and RAW 264.7 (b) macrophages were stimulated with LPS (1 μg/ml) in the absence or presence of dexamethasone (10−7 mol/l) as indicated. Actinomycin D (1 μg/ml) was added to the cells after 6 h of incubation. Cells treated with vehicle were used as the maximum point. Cells were harvested for RNA extraction after the incubation time indicated after actinomycin D addition, and CSE and GAPDH mRNA were detected by quantitative real-time RT-PCR. Each data point was expressed as mean percentage of the maximum determined at time zero ± SEM (n = 4). Dex dexamethasone
Fig. 12
Fig. 12
Effects of dexamethasone on CSE promoter activity in RAW264.7 macrophages. RAW264.7 cells were treated with dexamethasone at the indicated doses in the absence or presence of RU38,486 (10−6 mol/l) and LPS (1 μg/ml) for 12 h. CSE promoter activity was assayed as described in “Materials and Methods.” Data were presented as mean percentage of control ± SEM for four independent experiments. **P < 0.01 compared with control; ##P < 0.01 compared with LPS; †P < 0.05 compared with LPS plus dexamethasone. Dex dexamethasone, RU RU38,486

Similar articles

Cited by

References

    1. Moore PK, Bhatia M, Moochhala S. Hydrogen sulfide: from the smell of the past to the mediator of the future? Trends Pharmacol Sci. 2003;24:609–611. doi: 10.1016/j.tips.2003.10.007. - DOI - PubMed
    1. Wang R. Two’s company, three’s a crowd: can H2S be the third endogenous gaseous transmitter? FASEB J. 2002;16:1792–1798. doi: 10.1096/fj.02-0211hyp. - DOI - PubMed
    1. Bhatia M. Hydrogen sulfide as a vasodilator. IUBMB Life. 2005;57:603–606. doi: 10.1080/15216540500217875. - DOI - PubMed
    1. Qingyou Z, Junbao D, Weijin Z, Hui Y, Chaoshu T, Chunyu Z. Impact of hydrogen sulfide on carbon monoxide/heme oxygenase pathway in the pathogenesis of hypoxic pulmonary hypertension. Biochem Biophys Res Commun. 2004;317:30–37. doi: 10.1016/j.bbrc.2004.02.176. - DOI - PubMed
    1. Zhao W, Zhang J, Lu Y, Wang R. The vasorelaxant effect of H2S as a novel endogenous gaseous KATP channel opener. EMBO J. 2001;20:6008–6016. doi: 10.1093/emboj/20.21.6008. - DOI - PMC - PubMed

Publication types