. 2010 Aug;31(8):1157-73.
doi: 10.1002/hbm.20925.

Characterization of the hemodynamic modes associated with interictal epileptic activity using a deformable model-based analysis of combined EEG and functional MRI recordings

Affiliations

Characterization of the hemodynamic modes associated with interictal epileptic activity using a deformable model-based analysis of combined EEG and functional MRI recordings

Frédéric Grouiller et al. Hum Brain Mapp. 2010 Aug.

Abstract

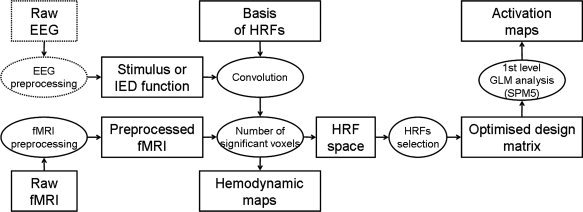
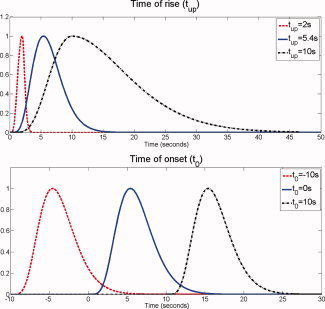
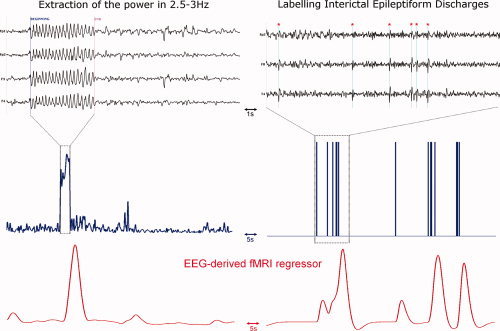
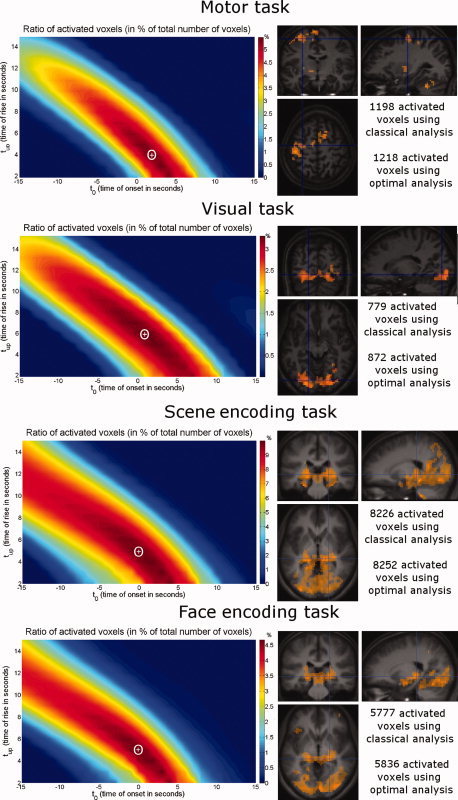
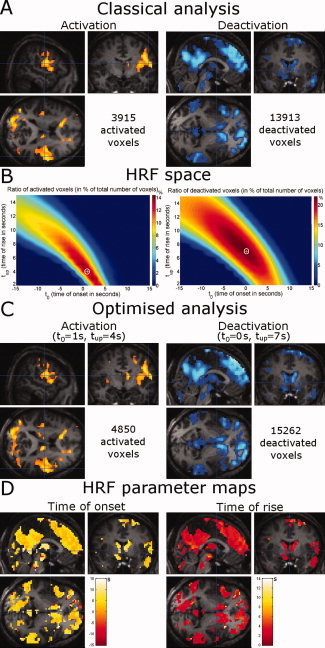
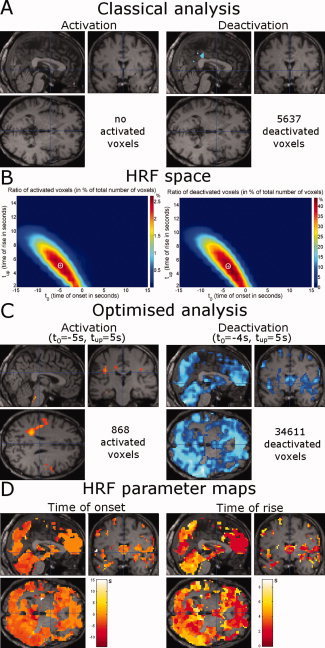
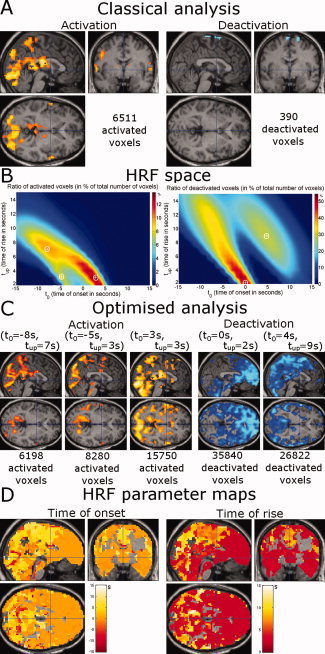
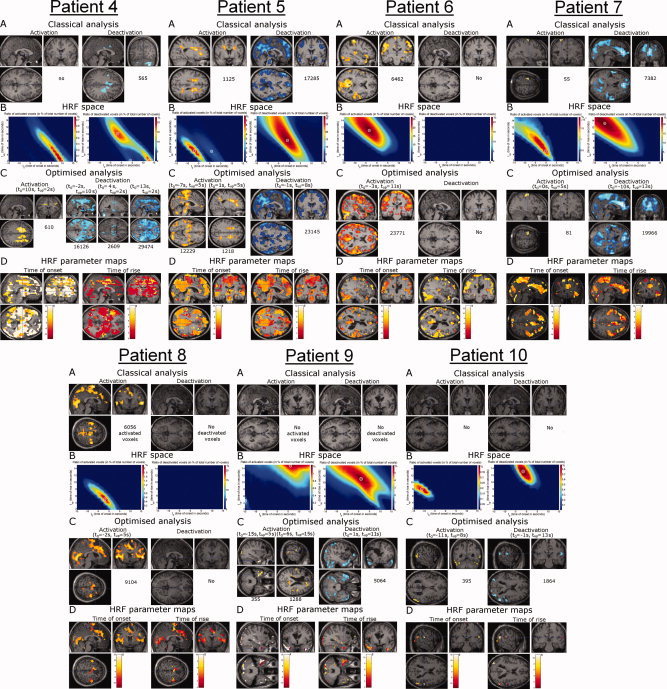
Simultaneous electroencephalography and functional magnetic resonance imaging (EEG/fMRI) have been proposed to contribute to the definition of the epileptic seizure onset zone. Following interictal epileptiform discharges, one usually assumes a canonical hemodynamic response function (HRF), which has been derived from fMRI studies in healthy subjects. However, recent findings suggest that the hemodynamic properties of the epileptic brain are likely to differ significantly from physiological responses. Here, we propose a simple and robust approach that provides HRFs, defined as a limited set of gamma functions, optimized so as to elicit strong activations after standard model-driven statistical analysis at the single subject level. The method is first validated on healthy subjects using experimental data acquired during motor, visual and memory encoding tasks. Second, interictal EEG/fMRI data measured in 10 patients suffering from epilepsy are analyzed. Results show dramatic changes of activation patterns, depending on whether physiological or pathological assumptions are made on the hemodynamics of the epileptic brain. Our study suggests that one cannot assume a priori that HRFs in epilepsy are similar to the canonical model. This may explain why a significant fraction of EEG/fMRI exams in epileptic patients are inconclusive after standard data processing. The heterogeneous perfusion in epileptic regions indicates that the properties of brain vasculature in epilepsy deserve careful attention.


Figures

Figure 1
Figure 1
Flowchart of the HRF optimization procedure: after preprocessing of fMRI and EEG data, activation maps are obtained using a design matrix optimized so as to maximize the number of significant voxels. Hemodynamic parameters maps are produced during the optimization of the design matrix.
Figure 2
Figure 2
Construction of the basis of HRFs. Top: Effect of the time scaling factor on the standard HRF. Bottom: Effect of the time of onset on the standard HRF. [Color figure can be viewed in the online issue, which is available at www.interscience.wiley.com.]
Figure 3
Figure 3
Construction of the fMRI regressors. Left: (top) EEG of an epileptic patient suffering from idiopathic generalized epilepsy, (middle) Power in 2.5–3 Hz band extracted from the EEG, (bottom) fMRI regressor after convolution of the power by the HRF. Right: (top) Interictal EEG of an epileptic patient suffering from right frontal lobe epilepsy. Spikes are indicated with a red star, (middle) manual labeling of the interictal spikes, (bottom) fMRI regressor after convolution of the spikes by the HRF. [Color figure can be viewed in the online issue, which is available at www.interscience.wiley.com.]
Figure 4
Figure 4
Functional tasks in healthy volunteers. From top to bottom: Motor task, visual task, scene encoding and face encoding. Left: mean ratio of activated voxels over all subjects. The white cross corresponds to the map local maximum whose coordinates give optimal HRF parameters. Right: group study activation (P < 0.005, uncorrected, extent threshold = 50 voxels) comparing classical analysis in yellow (t 0 = 0 s, t up = 5.4 s) and optimized analysis with HRF parameters corresponding to maximum mean ratio of activated voxels in red (Motor: t 0 = 2 s, t up = 4 s; Visual: t 0 = 1 s, t up = 6 s; Scene encoding: t 0 = 0 s, t up = 5 s; Face encoding: t 0 = 0 s, t up = 5 s). Orange areas, i.e. nearly all activated voxels, correspond to voxels activated with both analyses. [Color figure can be viewed in the online issue, which is available at www.interscience.wiley.com.]
Figure 5
Figure 5
Patient 1: frontal lobe epilepsy. (A) Activation and deactivation patterns using classical HRF (P < 0.005, FDR‐corrected, extent threshold = 50 voxels). (B) Ratio of activated and deactivated voxels in the HRF space. (C) Activation and deactivation patterns using optimal HRF (P < 0.005, FDR‐corrected, extent threshold = 50 voxels). (D) HRF parameter maps (left: time of onset t 0; right: time of rise t up). [Color figure can be viewed in the online issue, which is available at www.interscience.wiley.com.]
Figure 6
Figure 6
Patient 2: idiopathic generalized epilepsy. Same format as Figure 5. [Color figure can be viewed in the online issue, which is available at www.interscience.wiley.com.]
Figure 7
Figure 7
Patient 3: absence epilepsy. Same format as Figure 5. [Color figure can be viewed in the online issue, which is available at www.interscience.wiley.com.]
Figure 8
Figure 8
Patients 4–10. Same format as Figure 5. [Color figure can be viewed in the online issue, which is available at www.interscience.wiley.com.]

References

    1. Aghakhani Y, Kobayashi E, Bagshaw AP, Hawco C, Benar CG, Dubeau F, Gotman J ( 2006): Cortical and thalamic fMRI responses in partial epilepsy with focal and bilateral synchronous spikes. Clin Neurophysiol 117: 177–91. - PubMed
    1. Aguirre GK, Zarahn E, D'Esposito M ( 1998): The variability of human, BOLD hemodynamic responses. Neuroimage 8: 360–369. - PubMed
    1. Al‐Asmi A, Benar CG, Gross DW, Khani YA, Andermann F, Pike B, Dubeau F, Gotman J ( 2003): fMRI activation in continuous and spike‐triggered EEG‐fMRI studies of epileptic spikes. Epilepsia 44: 1328–1339. - PubMed
    1. Bagshaw AP, Aghakhani Y, Benar CG, Kobayashi E, Hawco C, Dubeau F, Pike GB, Gotman J ( 2004): EEG‐fMRI of focal epileptic spikes: Analysis with multiple haemodynamic functions and comparison with gadolinium‐enhanced MR angiograms. Hum Brain Mapp 22: 179–192. - PMC - PubMed
    1. Baudewig J, Bittermann HJ, Paulus W, Frahm J ( 2001): Simultaneous EEG and functional MRI of epileptic activity: A case report. Clin Neurophysiol 112: 1196–1200. - PubMed