. 2010 Aug;31(8):1233-48.
doi: 10.1002/hbm.20931.

The contrast dependence of the cortical fMRI deficit in amblyopia; a selective loss at higher contrasts

Affiliations

The contrast dependence of the cortical fMRI deficit in amblyopia; a selective loss at higher contrasts

Robert F Hess et al. Hum Brain Mapp. 2010 Aug.

Abstract

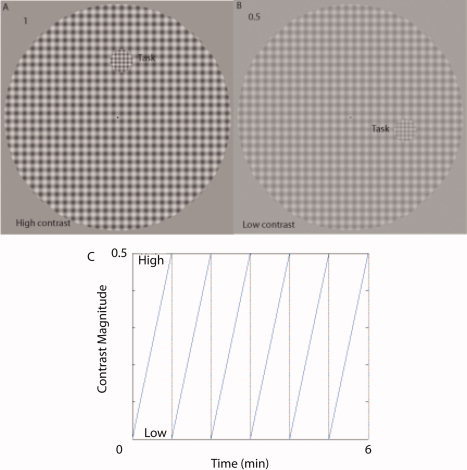
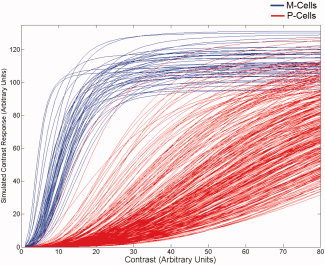
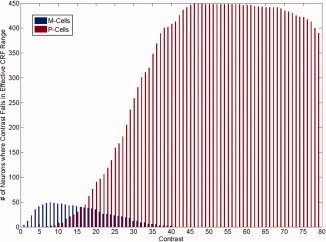
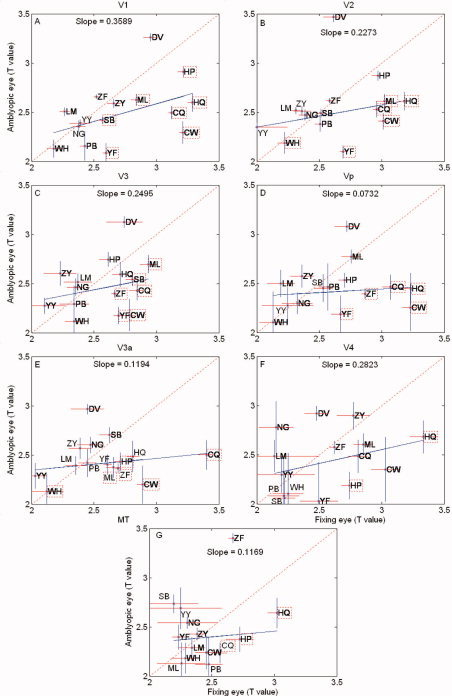
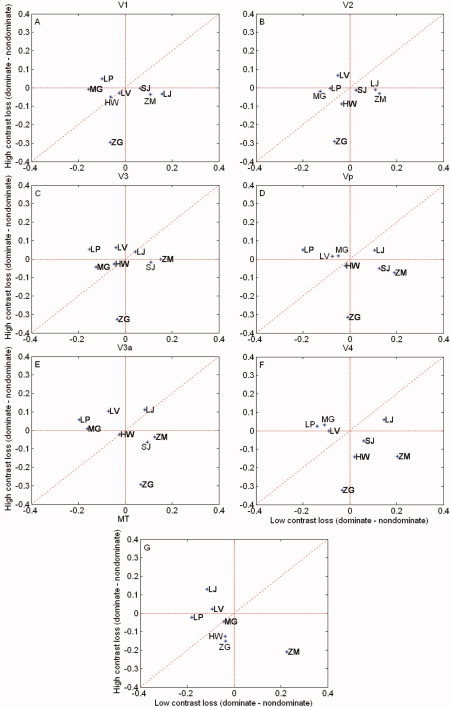
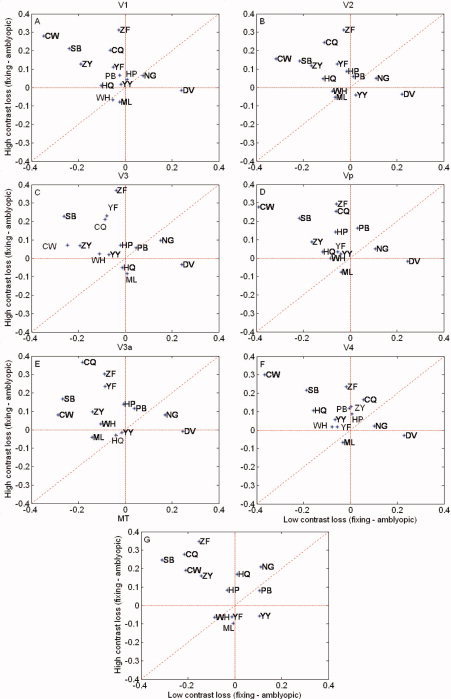
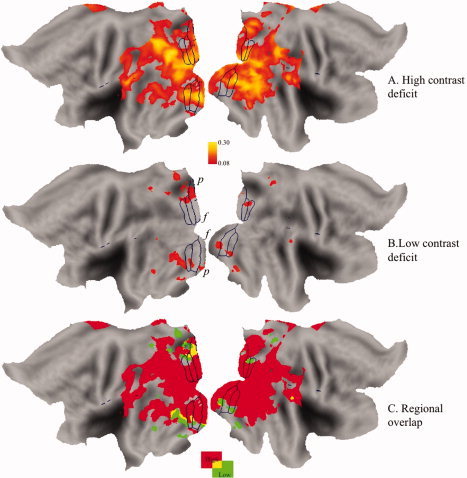
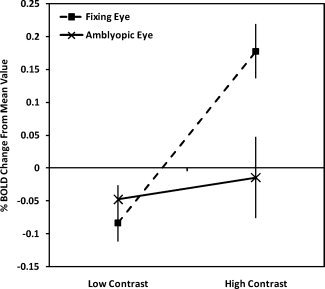
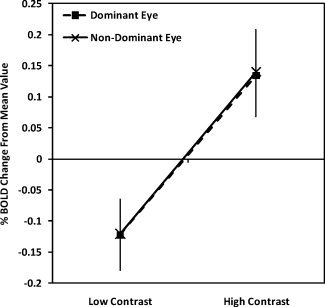
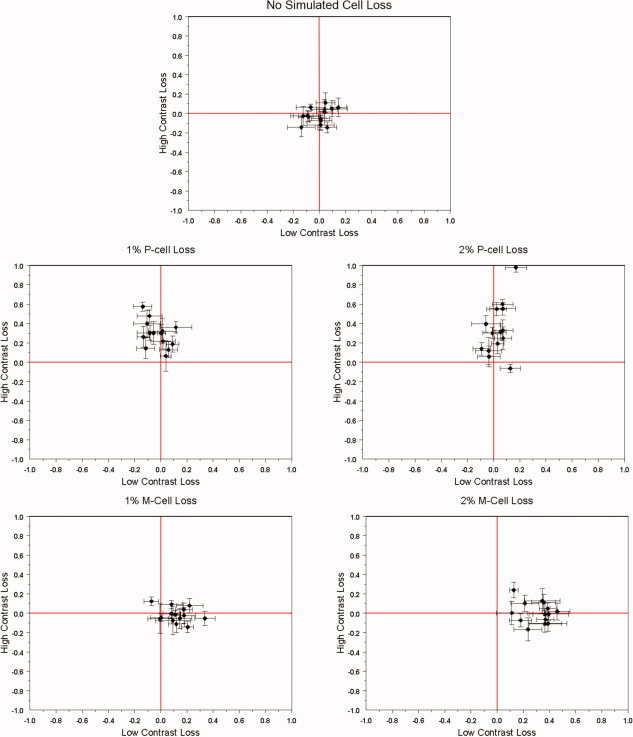
Although there is general agreement that the fMRI cortical response is reduced in humans with amblyopia, the deficit is subtle and has little correlation with threshold-based psychophysics. From a purely contrast sensitivity perspective, one would expect fMRI responses to be selectively reduced for stimuli of low contrasts. However, to date, all fMRI stimuli used in studies of amblyopia have been of high contrast. Furthermore, if the deficit is selective for low contrasts, one would expect it to reflect a selective M-cell loss, because M-cells have much higher contrast gain than P-cells and make a larger contribution to the threshold detection of stimuli of low spatial and medium temporal frequencies. To test these two predictions, we compared % BOLD response between the eyes of normals and amblyopes for low- and high-contrast stimuli using a phase-encoded design. The results suggest that the fMRI deficit in amblyopia depends upon stimulus contrast and that it is greater at high contrasts. This is consistent with a selective P-cell contrast deficit at a precortical or early cortical site.


Figures

Figure 1
Figure 1
A: Stimuli (1c/d; 2 Hz) used in this study, at highest contrast (50%). B: Stimuli used in this study, a low contrast (20% shown here for illustrative purposes only). C: Phased encoded design, contrast of the stimuli change linearly with time, from 0.5 to 0, and repeated for six cycles, each cycle taking 1 min to complete. [Color figure can be viewed in the online issue, which is available at www.interscience.wiley.com.]
Figure 2
Figure 2
An example of one of the simulated M‐ and P‐cell CRF populations used in the model (without simulated cell loss). On the ordinate is the contrast response (arbitrary units). On the abscissa is the contrast of the stimulus (also in arbitrary units).
Figure 3
Figure 3
Number of simulated neurons exhibiting an effective contrast response for a range of arbitrary contrast values. On the ordinate is the number of neurons encountered in each simulated cell subpopulation yielding an effective contrast response. On the abscissa is the contrast of the stimulus (arbitrary units).
Figure 4
Figure 4
Magnitude responses to the full cycle of stimulation for the contrast‐varying stimulus are given for different visual areas for a group of amblyopes. The Y‐axis is the response for the amblyopic eye (T‐values) and the X axis is the response of the fellow fixing eye (T‐values). The dashed line has a slope of unity and the solid line is the best fit () to the amblyopic data as a whole. Data for individual subjects are given by initials (see Table I), and initials enclosed by a dashed box indicate responses for an individual that are significantly reduced (T > 1.965: P < 0.05, two‐tailed t‐test) for the amblyopic eye. The following data overlap occurs; V1 (YY&NG), V2 (LM&YY), Vp (SB&PB), V3a (YY&ZF), and V4 (WH&SB). Responses for different retinotopic areas are given (A–G).
Figure 5
Figure 5
% BOLD change for the normal control subjects. Y axis is the difference in the BOLD signal change for high contrasts (dominant eye–nondominant eye). X axis is the difference for low contrasts (dominant eye–nondominant eye). Results are shown for the different retinotopic visual areas. Responses cluster around the origin, although there is some variability. Responses for different retinotopic areas are given (A–G).
Figure 6
Figure 6
% BOLD change for the amblyopic subjects. Y axis is the difference in the BOLD signal change for high contrasts (fixing eye–amblyopic eye). X axis is a comparable comparison at the low contrasts (fixing eye–amblyopic eye). Responses for the amblyopes extend further out from the origin (compared with Fig. 2, particularly into the upper left corner reflecting a greater loss for high‐contrast stimuli. The following data overlap occurs; V1(WH&ML), (PB&HP&YY), V2 (CW&ZY), (YY&WH), Vp (HP&WH&YP&YY), V3a(YY&HQ), V4(ZY&PB), (WH&YF), MT(ZY&PB), and (WH&YF). Responses for different retinotopic areas are given (A–G).
Figure 7
Figure 7
The averaged functional activation data for the high contrast (A) and low contrast (B) conditions on an averaged, standardized flattened cortex (Van Essen DC (2001): J Am Med Infor Soc 8:443–459) with standardized areal boundaries for reference. f denotes the fovea and p the periphery.
Figure 8
Figure 8
Amblyopic participants' averaged BOLD response change relative to the mean collapsed across visual areas for the low‐ and high‐contrast conditions
Figure 9
Figure 9
Control participants' averaged BOLD responses change relative to the mean collapsed across visual areas for the low‐ and high‐contrast conditions
Figure 10
Figure 10
Model simulations of the contrast loss from M‐ and P‐cell dysfunction. The model description is given in the Appendix, and it involves differential numbers of M and P‐cells as well as differences in their contrast gains. A selective P‐cell loss would affect higher contrasts whereas a selective M‐cell loss would affect low contrasts. The percentage of simulated loss for both M‐ and P‐cells for the AE reported in the text should not be taken as a literal estimate as they are based on the model CRF population parameters described in the Appendix. Nonetheless, the simulated contrast loss shown here for the P‐cell loss predicts the contrast loss shown in the fMRI data.

Similar articles

Cited by

References

    1. Aaen‐Stockdale C, Hess RF ( 2008): The amblyopic deficit for global motion is spatial scale invariant. Vision Res 48: 1965–1971. - PubMed
    1. Albrecht DG, Hamilton DB ( 1982): Striate cortex of monkey and cat: Contrast response function. J Neurophysiol 48: 217–237. - PubMed
    1. Algaze A, Roberts C, Leguire L, Schmalbrock P, Rogers G ( 2002): Functional magnetic resonance imaging as a tool for investigating amblyopia in the human cortex: A pilot study. J AAPOPS 6: 300–308. - PubMed
    1. Altmann L, Singer W ( 1986): Temporal integration in amblyopic vision. Vision Res 26: 1959–1968. - PubMed
    1. Anderson SA, Holliday IE, Harding GF ( 1999): Assessment of cortical dysfunction in human strabismic amblyopia using magnetoencephalography. Vision Res 39: 1723–1738. - PubMed

Publication types

MeSH terms