. 2010 Aug;31(8):1207-16.
doi: 10.1002/hbm.20929.

The effect of model order selection in group PICA

Affiliations

The effect of model order selection in group PICA

Ahmed Abou-Elseoud et al. Hum Brain Mapp. 2010 Aug.

Abstract

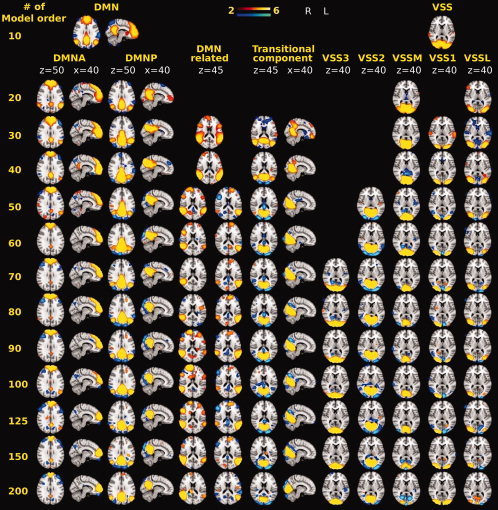
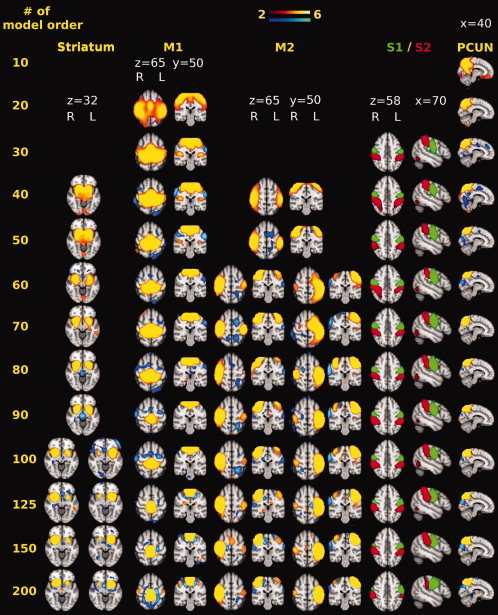
Independent component analysis (ICA) of functional MRI data is sensitive to model order selection. There is a lack of knowledge about the effect of increasing model order on independent components' (ICs) characteristics of resting state networks (RSNs). Probabilistic group ICA (group PICA) of 55 healthy control subjects resting state data was repeated 100 times using ICASSO repeatability software and after clustering of components, centrotype components were used for further analysis. Visual signal sources (VSS), default mode network (DMN), primary somatosensory (S(1)), secondary somatosensory (S(2)), primary motor cortex (M(1)), striatum, and precuneus (preC) components were chosen as components of interest to be evaluated by varying group probabilistic independent component analysis (PICA) model order between 10 and 200. At model order 10, DMN and VSS components fuse several functionally separate sources that at higher model orders branch into multiple components. Both volume and mean z-score of components of interest showed significant (P < 0.05) changes as a function of model order. In conclusion, model order has a significant effect on ICs characteristics. Our findings suggest that using model orders < or =20 provides a general picture of large scale brain networks. However, detection of some components (i.e., S(1), S(2), and striatum) requires higher model order estimation. Model orders 30-40 showed spatial overlapping of some IC sources. Model orders 70 +/- 10 offer a more detailed evaluation of RSNs in a group PICA setting. Model orders > 100 showed a decrease in ICA repeatability, but added no significance to either volume or mean z-score results.


Figures

Figure 1
Figure 1
Example images showing the effect of increasing model order on resting state DMN, DMN‐related and VSS components. At model order 10, components such as DMN and VSS were detected then at model order 20 both DMN and VSS branched into [DMNA and DMNP] and VSS into [VSSL and VSSM]. Then at model order 30, VSS1, DMN‐related and the transitional component emerged. At model order 50, VSS2 component emerged, DMN‐related branched into two subcomponents. A transitional zone where a spatial overlapping and transition of activated brain regions took place (model orders 30–40). At model order 70, VSS3 component emerged.
Figure 2
Figure 2
Example images showing the effect of increasing model order on resting state striatum, M1, M2, S1, S2, and preC components. S1 and S2 are shown in green and red for visual feasibility purposes. At model order 10, preC emerged. M1 appeared at model order 20. Both S1 and S2 emerged at model order 30 showing no branching at higher model orders. Then at model order 40, both M2 and striatum components were detected and then later branched into right or left dominant components at model orders 60 and 100, respectively.
Figure 3
Figure 3
On the left side, volume of all components of interest except DMNP (P = 0.06) show a significant decrease (P < 0.05) as a function of model order. All components of interest except S1 and S2 show a maximum significant decrease in volume up to model orders 70–80. Above model order 80, no significant changes in volume occur. On the right side, mean z‐score of all components of interest show a general trend of increase as a function of model order. DMNP, VSSL, S2, and preC show a significant increase in mean z‐score up to model orders 70–80. Above model order 80, no significant changes occur in mean z‐score.
Figure 4
Figure 4
(A) ICASSO components' repeatability represented by mean of cluster quality index (I q) showing a significant decrease as a function of model order (P = 2 × 10⁻⁷). (B) I q of resting state DMNA, DMNP, VSSM, VSSL, preC, and S2. Both DMNA and VSSL showed low and varying repeatability at model orders below 60 then a stable high repeatability between 60 and 100 model orders. DMNP and VSSM were relatively stable until model order 50. Between model orders 40 and 70, preCshowed varying repeatability then a stable high repeatability reaching 150. Both S1 and M1 showed stable high repeatability up to model order 100 and 150, respectively, after that their repeatability also decreased. S2 showed varying repeatability below model order 100 followed by a gradual reduction in repeatability.

Similar articles

Cited by

References

    1. Achard S, Salvador R, Whitcher B, Suckling J, Bullmore E ( 2006): A resilient, low frequency, small‐world human brain functional network with highly connected association cortical hubs. J Neurosci 26: 63–72. - PMC - PubMed
    1. Bartels A, Zeki S ( 2005): Brain dynamics during natural viewing conditions—A new guide for mapping connectivity in vivo. Neuroimage 24: 339–349. - PubMed
    1. Beckmann CF, Smith SM ( 2004): Probabilistic independent component analysis for functional magnetic resonance imaging. IEEE Trans Med Imaging 23: 137–152. - PubMed
    1. Beckmann CF, DeLuca M, Devlin JT, Smith SM ( 2005): Investigations into resting‐state connectivity using independent component analysis. Philos Trans R Soc Lond B Biol Sci 360: 1001–1013. - PMC - PubMed
    1. Bell AJ, Sejnowski TJ ( 1995): An information‐maximization approach to blind separation and blind deconvolution. Neural Comput 7: 1004–1034. - PubMed

Publication types