. 2010 Jan;78(1):197-211.
doi: 10.1002/prot.22507.

GPCR 3D homology models for ligand screening: lessons learned from blind predictions of adenosine A2a receptor complex

Affiliations

GPCR 3D homology models for ligand screening: lessons learned from blind predictions of adenosine A2a receptor complex

Vsevolod Katritch et al. Proteins. 2010 Jan.

Abstract

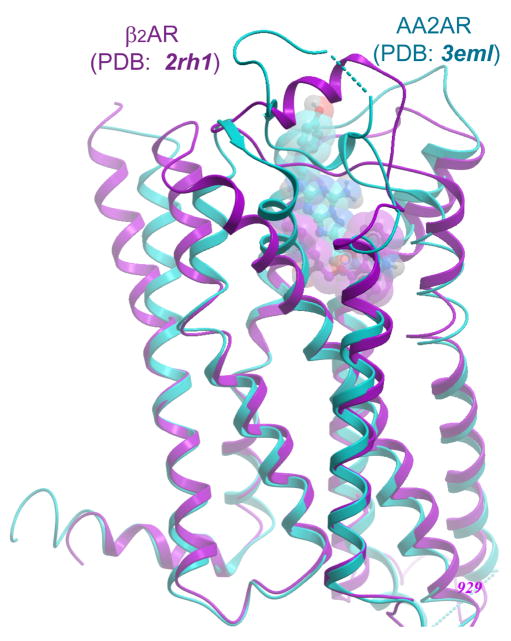
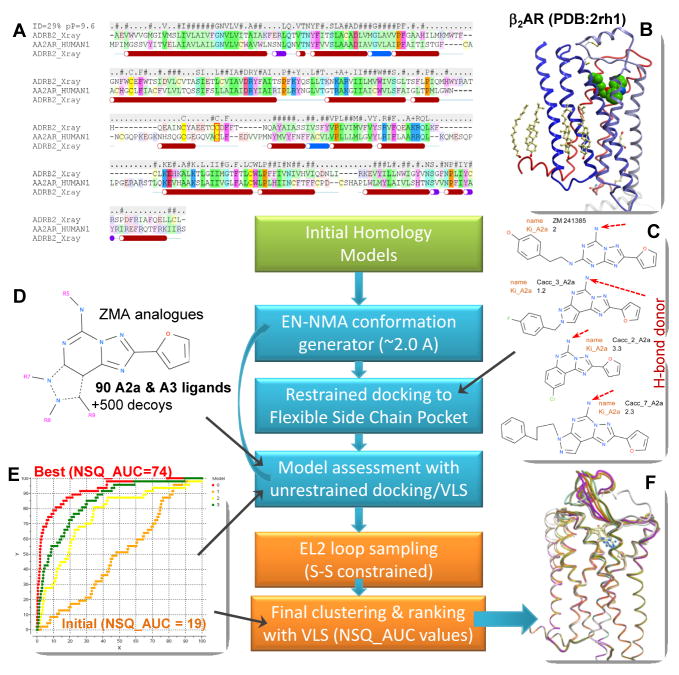
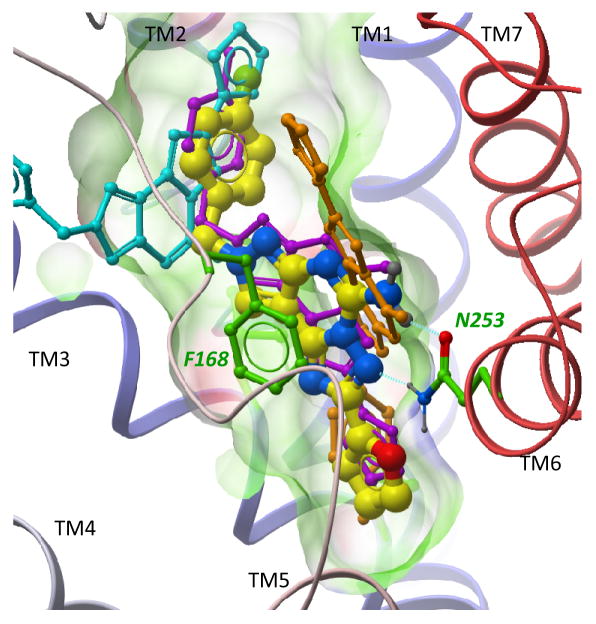
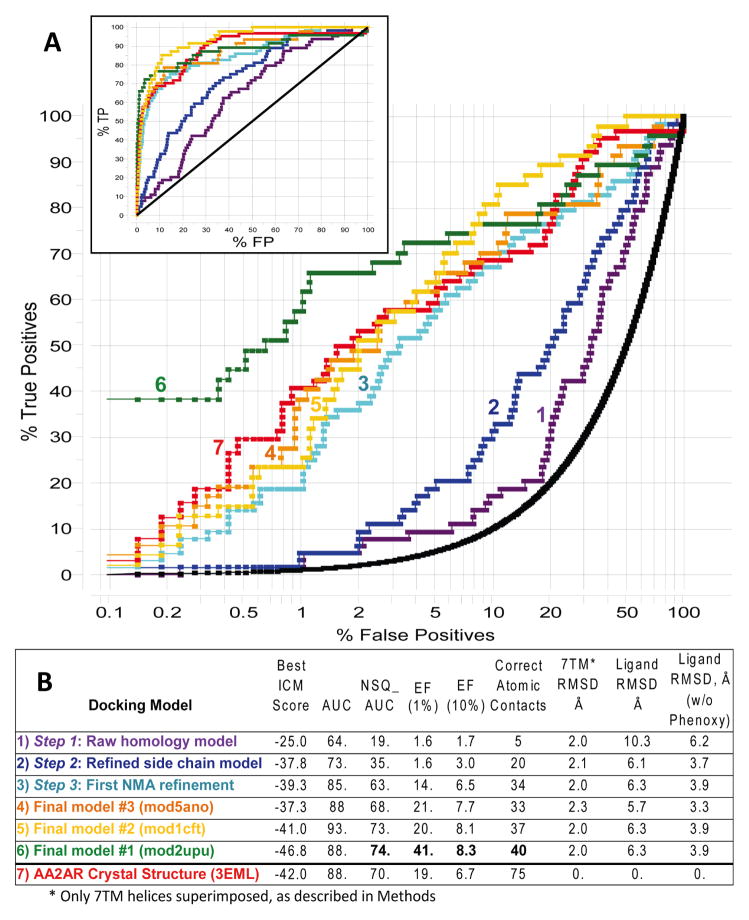
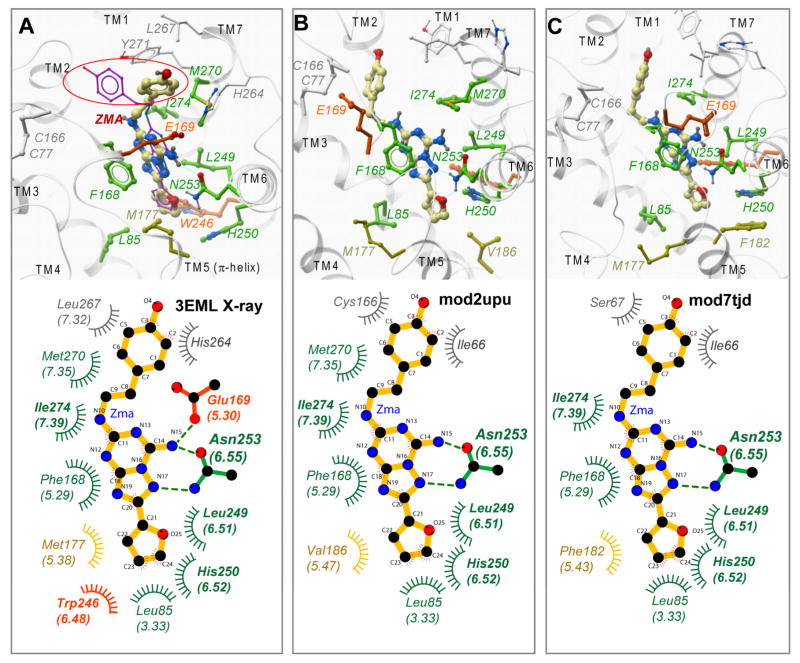
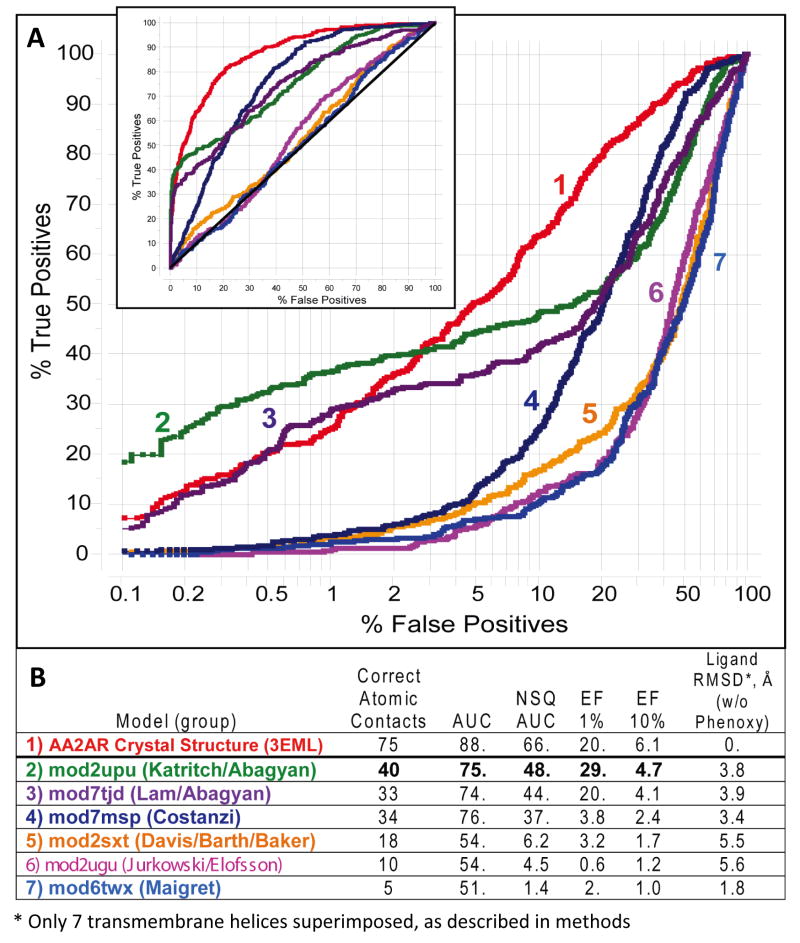
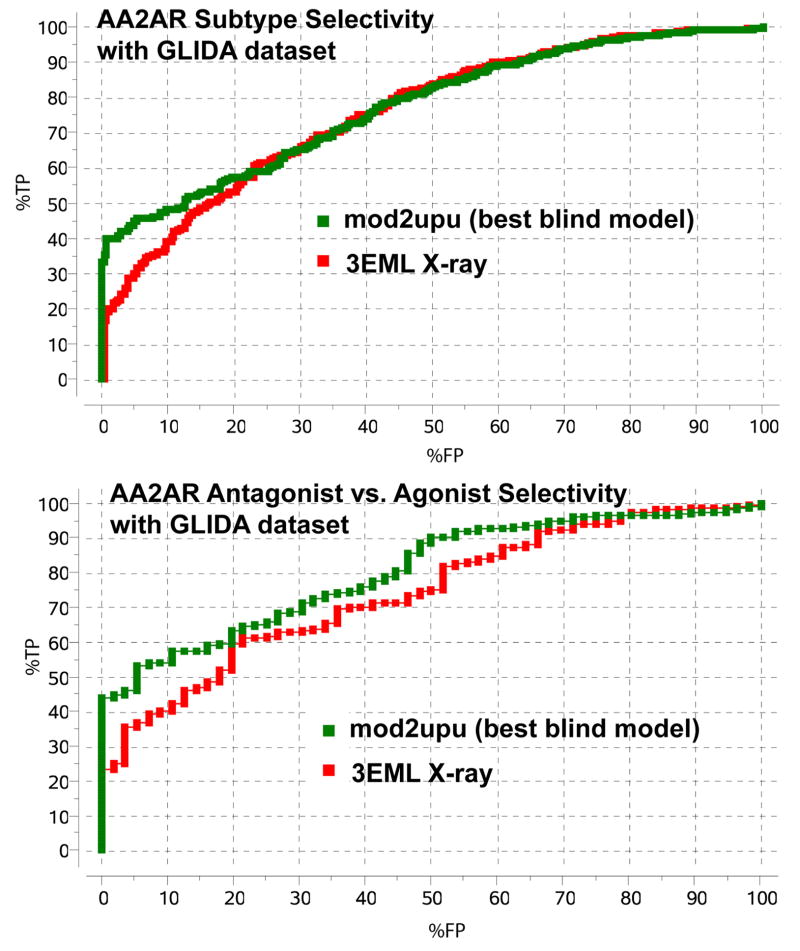
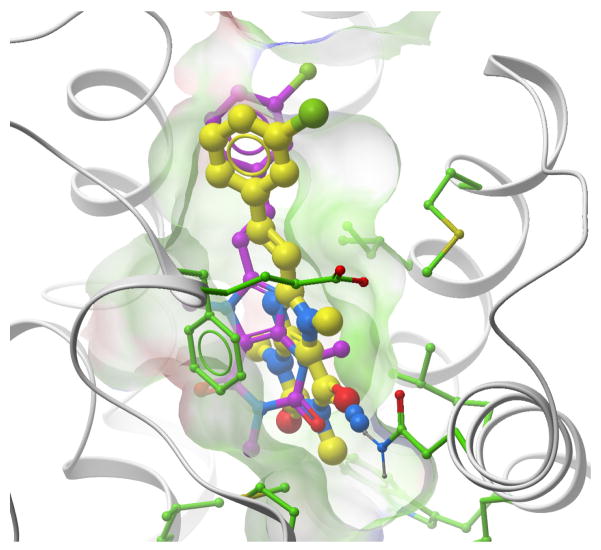
Proteins of the G-protein coupled receptor (GPCR) family present numerous attractive targets for rational drug design, but also a formidable challenge for identification and conformational modeling of their 3D structure. A recently performed assessment of blind predictions of adenosine A2a receptor (AA2AR) structure in complex with ZM241385 (ZMA) antagonist provided a first example of unbiased evaluation of the current modeling algorithms on a GPCR target with approximately 30% sequence identity to the closest structural template. Several of the 29 groups participating in this assessment exercise (Michino et al., doi: 10.1038/nrd2877) successfully predicted the overall position of the ligand ZMA in the AA2AR ligand binding pocket, however models from only three groups captured more than 40% the ligand-receptor contacts. Here we describe two of these top performing approaches, in which all-atom models of the AA2AR were generated by homology modeling followed by ligand guided backbone ensemble receptor optimization (LiBERO). The resulting AA2AR-ZMA models, along with the best models from other groups are assessed here for their vitual ligand screening (VLS) performance on a large set of GPCR ligands. We show that ligand guided optimization was critical for improvement of both ligand-receptor contacts and VLS performance as compared to the initial raw homology models. The best blindly predicted models performed on par with the crystal structure of AA2AR in selecting known antagonists from decoys, as well as from antagonists for other adenosine subtypes and AA2AR agonists. These results suggest that despite certain inaccuracies, the optimized homology models can be useful in the drug discovery process.


Figures

Figure 1
Figure 1
Structures of β2AR/carazolol (PDB code 2rh1) and AA2AR/ZMA (PDB code 3eml) complexes are shown (magenta and cyan respectively), with superimposed Cα atoms of seven transmembrane helices (7TM).
Figure 2
Figure 2
A flowchart of the modeling algorithm. Initial homology modeling (green block) uses AA2AR/β2AR alignment (A) and β2AR structural template (B). The ligand-guided optimization procedure (cyan blocks) generates multiple conformations of the protein backbone with EN·NMA algorithm, which is followed by docking selected ligands (C) into the models with flexible side chains. Resulting models of receptor are evaluated by fast (rigid) docking of a set of AA2AR ligands and decoys (D), and the models with the best NSQ_AUC values (E) are selected. Final modeling steps (orange blocks) include loop modeling and ranking of the final AA2AR-ZMA models (F).
Figure 3
Figure 3
Examples of best scoring poses for compound #3 from ref., docked into AA2AR models at different optimization stages: (1) raw homology modeling (orange) (2) side chains refinement (cyan) (3) first iteration of ligand-guided refinement (magenta) (4) second iteration of ligand-guided refinement (thick balls and sticks with yellow carbons). The model of AA2AR (as in mod2upu) is shown by ribbon colored from N- to C-terminal (from blue to red), ligand binding pocket of the model shown by transparent skin.
Figure 4
Figure 4
Results of small-scale VLS evaluation for our AA2AR models at different stages of the optimization procedure, as well as for our three best models submitted to assessment. A. ROC curves for each of the models, shown in logarithmic scale to emphasize initial enrichment at 1% of the dataset (Insert shows a standard view of the ROC curves). B. The table listing key characteristics of the corresponding ROC curves and the overall quality of the model structures for the models as compared to the crystal structure (PDB code 3eml). The values of NSQ_AUC, enrichment factors and number of contacts are shown in bold for our rank#1 model.
Figure 5
Figure 5
Comparison of the AA2AR-ZMA crystal structure (A) with the top ranked models from Katritch/Abagyan (B) and Lam/Abagyan (C) groups. Top panels show 3D snapshots and bottom panels show 2D plots of ligand interacting side chains of the receptor. The ligand is shown with yellow carbons, the protein backbone is shown by grey ribbons. Ligand-receptor hydrogens bonds are shown by cyan dashed lines. An alternative (magenta) conformation in the top panel A represents ZMA ligand docked by ICM into the crystal structure of AA2AR, phenoxy moiety of ZMA circled red. The protein side chains in both 2D and 3D presentations are colored according to the ZMA-residue contact predictions: green residues, contacts correctly predicted by mod2upu model; orange residues, contacts not predicted; yellow residues, hydrophobic contacts replaced by another side chain; grey residues, contacts of the phenoxy ring that do not have major contribution into ligand binding. Note that contact residues suggested by previous mutation analysis are in bold font.
Figure 6
Figure 6
Results of large-scale VLS evaluation with GLIDA database ligands for the top six models described in Table I of ref.. A. ROC curves for each of the models, shown in logarithmic scale to emphasize initial enrichment at 1% of the dataset (Insert shows a regular view of the ROC curves). B. The table listing key characteristics of the corresponding ROC curves, number of atomic contact and ligand RMSD for the models, as compared to the crystal structure (PDB code 3eml). The values of NSQ_AUC, enrichment factors and number of contacts are shown in bold for our rank#1 model.
Figure 7
Figure 7
Correlation between the VLS performance and the number of correct atomic contacts for the AA2AR models. Brown squares show results for our intermediate models evaluated with the small ligand set as listed in Figure 4. Blue diamonds show results for the top 6 models from ref, evaluated with the large GLIDA dataset, as listed in Figure 6. Regression line is shown only for GLIDA dataset results.
Figure 8
Figure 8
Selectivity profile for our model ranked #1 (mod2upu). (A) Subtype selectivity, AA2AR vs. adenosine receptor subtypes AA1R and AA3R. (B) Antagonist vs. Agonist selectivity.
Figure 9
Figure 9
A xanthine analogue (GLIDA ID#L011922) docked into the AA2AR. The crystal structure (3eml) of the receptor is shown by grey ribbon sticks with green carbons. The ligand conformation docked into the crystal structure has yellow colored carbon atoms, the conformation docked into the blindly predicted model (mod2upu) has magenta colored carbons.

Similar articles

Cited by

References

    1. Reynolds K, Abagyan R, Katritch V. 3d structure and modeling of GPCRs: implications for drug discovery. In: Gilchrist A, editor. Shifting Paradigms in G Protein Coupled Receptors. Hoboken, NJ: Wiley & Sons, Inc; 2009. in press.
    1. Tyndall JD, Sandilya R. GPCR agonists and antagonists in the clinic. Med Chem. 2005;1(4):405–421. - PubMed
    1. Lagerstrom MC, Schioth HB. Structural diversity of G protein-coupled receptors and significance for drug discovery. Nat Rev Drug Discov. 2008;7(4):339–357. - PubMed
    1. Jacoby E, Bouhelal R, Gerspacher M, Seuwen K. The 7 TM G-protein-coupled receptor target family. ChemMedChem. 2006;1(8):761–782. - PubMed
    1. Palczewski K, Kumasaka T, Hori T, Behnke CA, Motoshima H, Fox BA, Le Trong I, Teller DC, Okada T, Stenkamp RE, Yamamoto M, Miyano M. Crystal structure of rhodopsin: A G protein-coupled receptor. Science. 2000;289(5480):739–745. - PubMed

Publication types

LinkOut - more resources