

Effect of training-sample size and classification difficulty on the accuracy of genomic predictors
- PMID: 20064235
- PMCID: PMC2880423
- DOI: 10.1186/bcr2468
Effect of training-sample size and classification difficulty on the accuracy of genomic predictors
Abstract
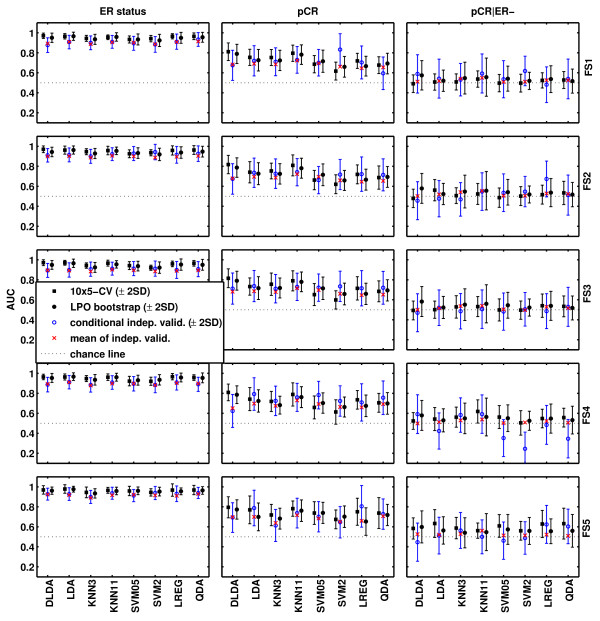
Introduction: As part of the MicroArray Quality Control (MAQC)-II project, this analysis examines how the choice of univariate feature-selection methods and classification algorithms may influence the performance of genomic predictors under varying degrees of prediction difficulty represented by three clinically relevant endpoints.
Methods: We used gene-expression data from 230 breast cancers (grouped into training and independent validation sets), and we examined 40 predictors (five univariate feature-selection methods combined with eight different classifiers) for each of the three endpoints. Their classification performance was estimated on the training set by using two different resampling methods and compared with the accuracy observed in the independent validation set.
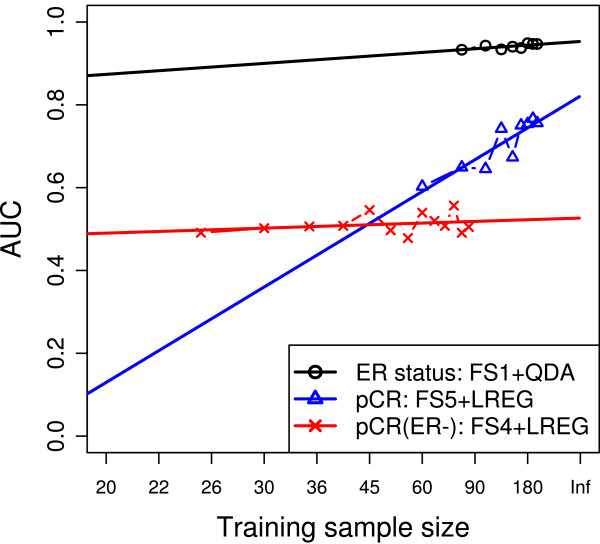
Results: A ranking of the three classification problems was obtained, and the performance of 120 models was estimated and assessed on an independent validation set. The bootstrapping estimates were closer to the validation performance than were the cross-validation estimates. The required sample size for each endpoint was estimated, and both gene-level and pathway-level analyses were performed on the obtained models.
Conclusions: We showed that genomic predictor accuracy is determined largely by an interplay between sample size and classification difficulty. Variations on univariate feature-selection methods and choice of classification algorithm have only a modest impact on predictor performance, and several statistically equally good predictors can be developed for any given classification problem.
Figures


References
-
- Vijver MJ van de, He YD, van't Veer LJ, Dai H, Hart AAM, Voskuil DW, Schreiber GJ, Peterse JL, Roberts C, Marton MJ, Parrish M, Atsma D, Witteveen A, Glas A, Delahaye L, Velde T van der, Bartelink H, Rodenhuis S, Rutgers ET, Friend SH, Bernards R. A gene-expression signature as a predictor of survival in breast cancer. N Engl J Med. 2002;347:1999–2009. doi: 10.1056/NEJMoa021967. - DOI - PubMed
-
- Paik S, Shak S, Tang G, Kim C, Baker J, Cronin M, Baehner FL, Walker MG, Watson D, Park T, Hiller W, Fisher ER, Wickerham DL, Bryant J, Wolmark N. A multigene assay to predict recurrence of tamoxifen-treated, node-negative breast cancer. N Engl J Med. 2004;351:2817–2826. doi: 10.1056/NEJMoa041588. - DOI - PubMed
-
- Dudoit S, Fridlyand J, Speed TP. Comparison of discrimination methods for the classification of tumors using gene expression data. J Am Statist Assoc. 2002;97:77–87. doi: 10.1198/016214502753479248. - DOI
-
- Perou CM, Sørlie T, Eisen MB, Rijn M van de, Jeffrey SS, Rees CA, Pollack JR, Ross DT, Johnsen H, Akslen LA, Fluge O, Pergamenschikov A, Williams C, Zhu SX, Lønning PE, Børresen-Dale AL, Brown PO, Botstein D. Molecular portraits of human breast tumours. Nature. 2000;406:747–752. doi: 10.1038/35021093. - DOI - PubMed
Publication types
MeSH terms
Substances
Grants and funding
LinkOut - more resources
Full Text Sources
Medical
Molecular Biology Databases
Research Materials
