. 2010 Jan 11:10:9.
doi: 10.1186/1471-2407-10-9.

Immunohistochemical analysis of oxidative stress and DNA repair proteins in normal mammary and breast cancer tissues

Affiliations

Immunohistochemical analysis of oxidative stress and DNA repair proteins in normal mammary and breast cancer tissues

Carol D Curtis et al. BMC Cancer. .

Abstract

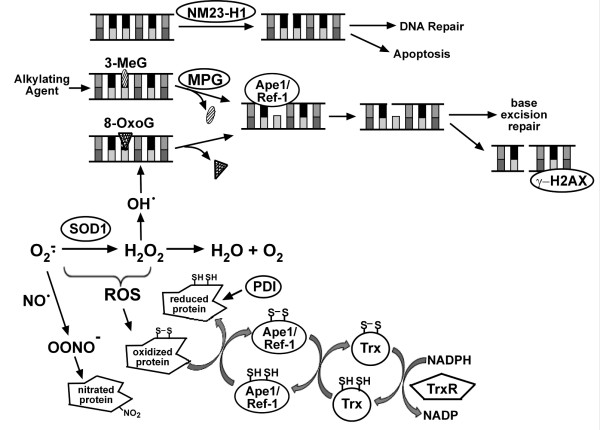
Background: During the course of normal cellular metabolism, oxygen is consumed and reactive oxygen species (ROS) are produced. If not effectively dissipated, ROS can accumulate and damage resident proteins, lipids, and DNA. Enzymes involved in redox regulation and DNA repair dissipate ROS and repair the resulting damage in order to preserve a functional cellular environment. Because increased ROS accumulation and/or unrepaired DNA damage can lead to initiation and progression of cancer and we had identified a number of oxidative stress and DNA repair proteins that influence estrogen responsiveness of MCF-7 breast cancer cells, it seemed possible that these proteins might be differentially expressed in normal mammary tissue, benign hyperplasia (BH), ductal carcinoma in situ (DCIS) and invasive breast cancer (IBC).

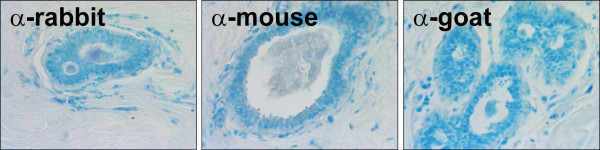
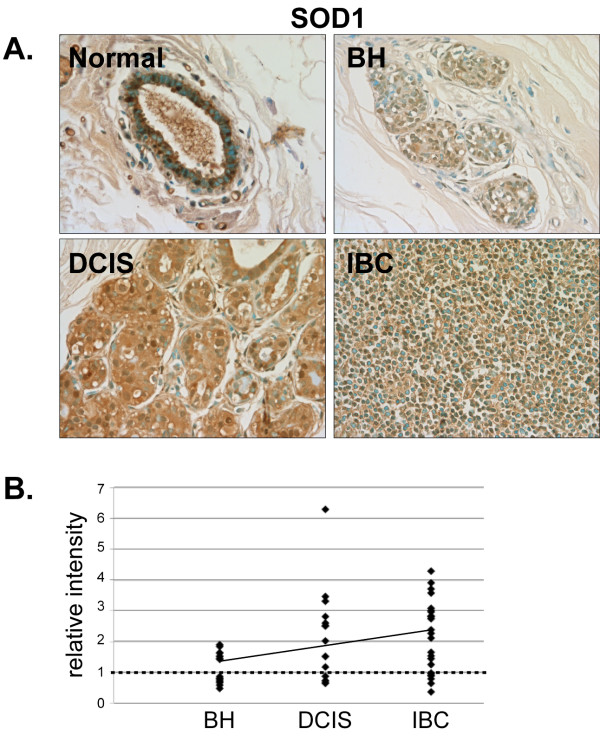
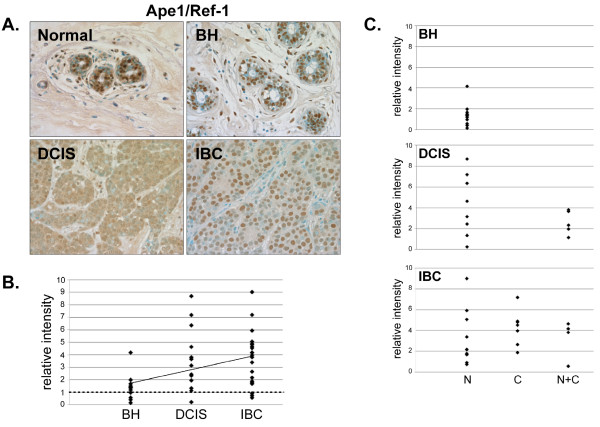
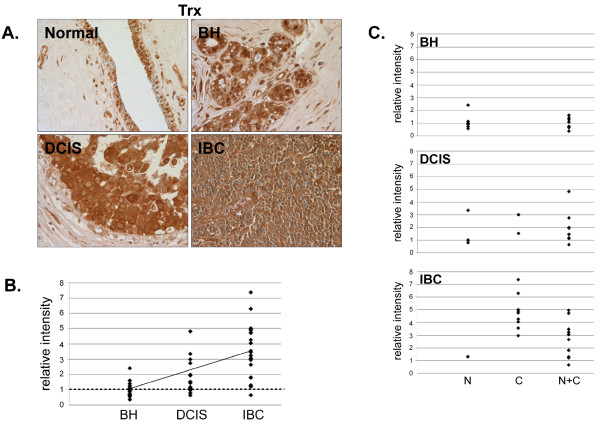
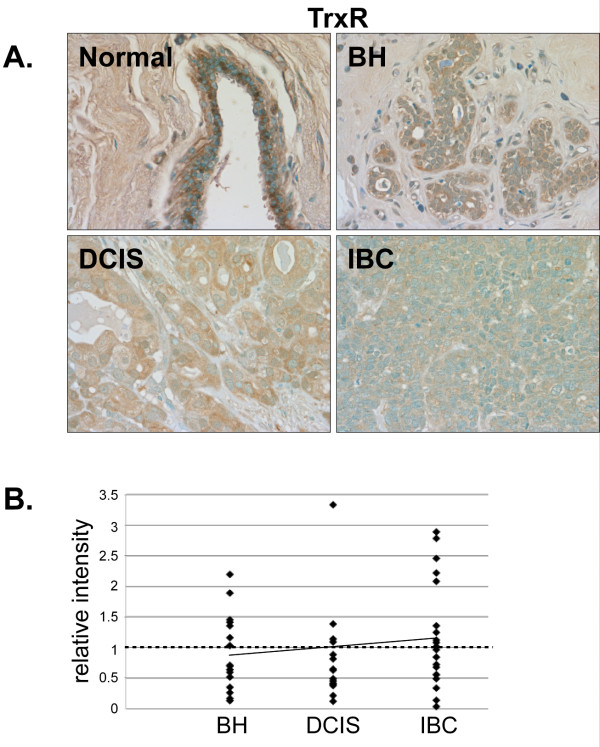
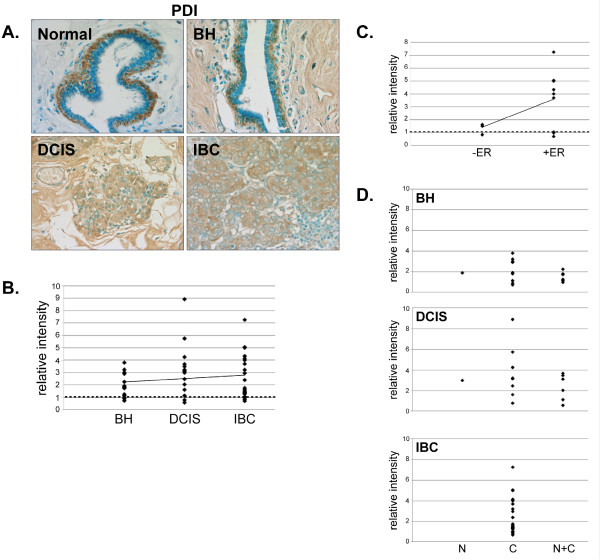
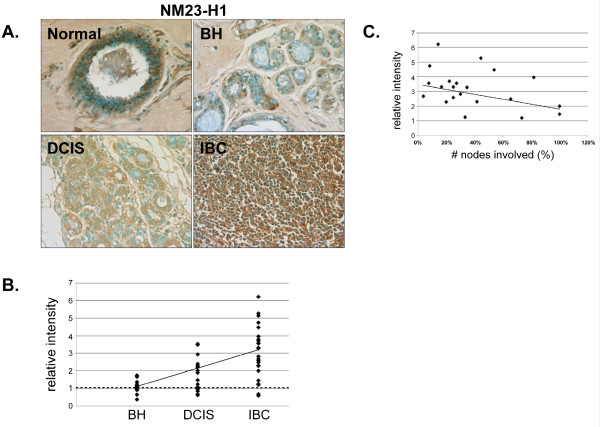
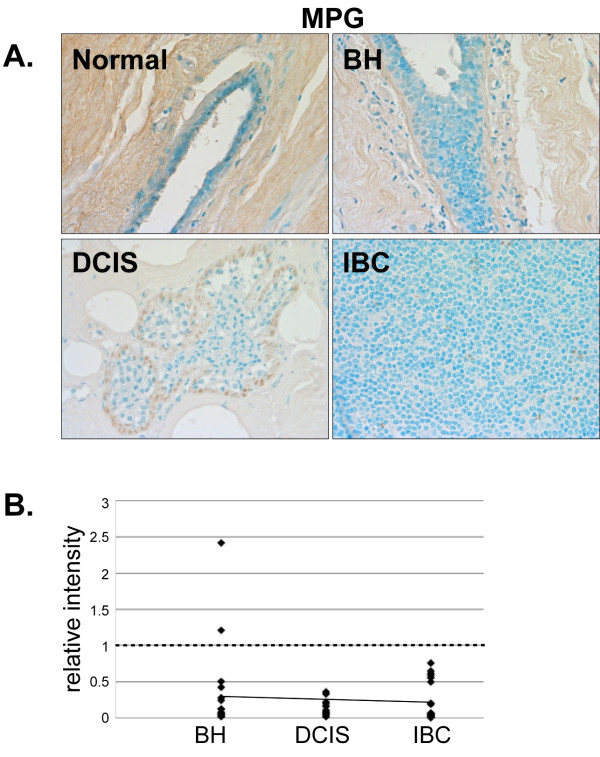
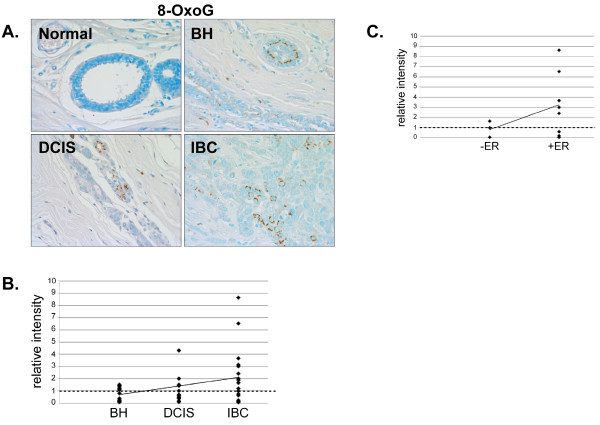
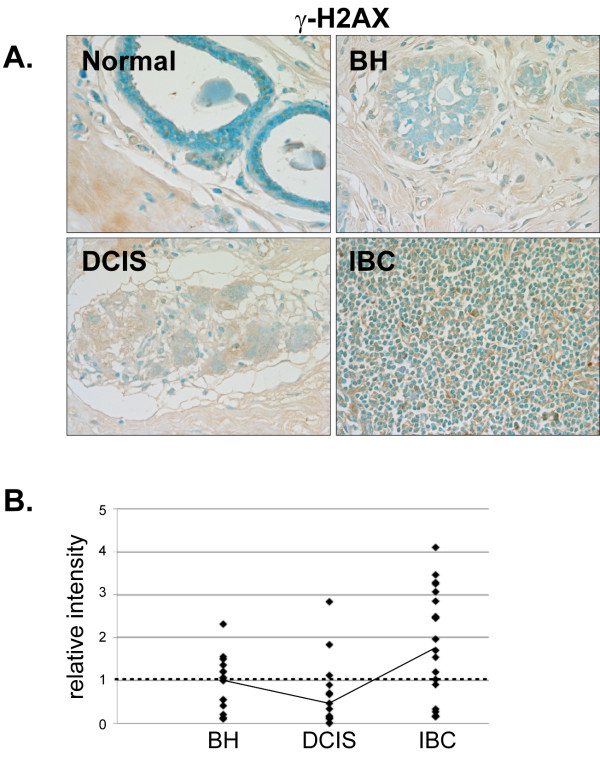
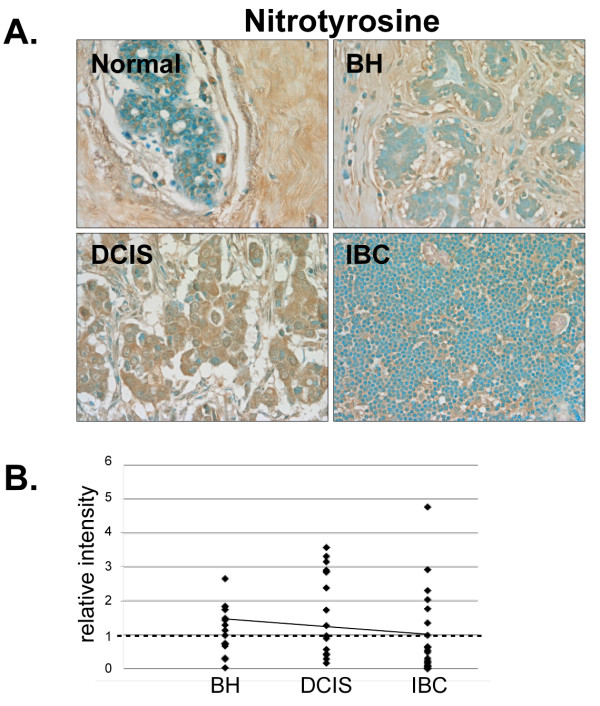
Methods: Immunohistochemistry was used to examine the expression of a number of oxidative stress proteins, DNA repair proteins, and damage markers in 60 human mammary tissues which were classified as BH, DCIS or IBC. The relative mean intensity was determined for each tissue section and ANOVA was used to detect statistical differences in the relative expression of BH, DCIS and IBC compared to normal mammary tissue.

Results: We found that a number of these proteins were overexpressed and that the cellular localization was altered in human breast cancer tissue.

Conclusions: Our studies suggest that oxidative stress and DNA repair proteins not only protect normal cells from the damaging effects of ROS, but may also promote survival of mammary tumor cells.


Figures

Figure 1
Figure 1
Role of oxidative stress and DNA repair proteins in cells. NM23-H1 induced DNA nicks may lead to DNA repair or apoptosis. Endogenous or exogenous alkylating agents cause DNA lesions such as 3-methylguanine (3-MeG), which are recognized and removed by MPG and leave apurinic sites. Ape1/Ref-1 recognizes apurinic sites and cleaves the adjacent DNA backbone. DNA repair can be completed through the base excision repair pathway. If not repaired, apurinic sites can result in double-stranded breaks. γ-H2AX associates with double-stranded breaks and recruits DNA repair proteins. Reactive oxygen species (ROS), which include superoxide (O2–·), hydrogen peroxide (H2O2), and hydroxyl radical (OH·), are formed as byproducts of normal cellular metabolism and can produce DNA lesions such as 8-OxoG, which are excised by cellular DNA glycosylases. Accumulated O2 interacts with nitric oxide (NO·) to produce peroxynitrite (OONO–), which in turn nitrates tyrosines and alters protein structure/function. TrxR uses NADPH to reduce Trx, which in turn reduces and activates Ape1/Ref-1. Activated Ape1/Ref-1 reduces a number of proteins including various transcription factors.
Figure 2
Figure 2
Validation of IHC in normal mammary tissue. Normal mammary tissue was subjected to IHC without primary antibody but with the secondary antibodies used to detect oxidative stress and DNA repair proteins as well as markers of protein and DNA damage. Representative slides are shown at 40× magnification.
Figure 3
Figure 3
Expression of SOD1 in normal, BH, DCIS and IBC tissue. A. Tissues were subjected to IHC using an SOD1-specific antibody. Representative slides are shown at 40× magnification. B. The relative mean intensity was determined from 6-8 images for each BH (n = 16), DCIS (n = 15) or IBC (n = 25) section and is shown graphically. ANOVA was used to detect statistical differences in the relative expression of BH, DCIS (p = 0.0051) and IBC (p = 0.0002) compared to normal mammary tissue, where normal mammary tissue is equal to one (dashed line).
Figure 4
Figure 4
Expression of Ape1/Ref-1 in normal, BH, DCIS and IBC tissue. A. Tissues were subjected to IHC using an Ape1/Ref-1-specific antibody. Representative slides are shown at 40× magnification. B. The relative mean intensity was determined from 6-8 images for each BH (n = 13), DCIS (n = 13) or IBC (n = 22) section and is shown graphically. ANOVA was used to detect statistical differences in the relative expression of BH, DCIS (p = 0.0002) and IBC (p < 0.0001) compared to normal mammary tissue, where normal mammary tissue is equal to one (dashed line). C. Cellular localization of Ape1/Ref-1 expression was determined for each tissue section, classified by disease state and shown graphically (N, nuclear; C, cytoplasmic; N+C, nuclear and cytoplasmic).
Figure 5
Figure 5
Expression of Trx in normal, BH, DCIS and IBC tissue. A. Tissues were subjected to IHC using a Trx-specific antibody. Representative slides are shown at 40× magnification. B. The relative mean intensity was determined from 6-8 images for each BH (n = 16), DCIS (n = 15) or IBC (n = 22) section and is shown graphically. ANOVA was used to detect statistical differences in the relative expression of BH, DCIS (p = 0.0039) and IBC (p < 0.0001) compared to normal mammary tissue, where normal mammary tissue is equal to one (dashed line). C. Cellular localization of Trx expression was determined for each tissue section, classified by disease state and shown graphically (N, nuclear; C, cytoplasmic; N+C, nuclear and cytoplasmic).
Figure 6
Figure 6
Expression of TrxR in normal, BH, DCIS and IBC tissue. A. Tissues were subjected to IHC using a TrxR-specific antibody. Representative slides are shown at 40× magnification. B. The relative mean intensity was determined from 6-8 images for each BH (n = 16), DCIS (n = 15) or IBC (n = 20) section and is shown graphically. The intensity of normal mammary tissue is equal to one (dashed line).
Figure 7
Figure 7
Expression of PDI in normal, BH, DCIS and IBC tissue. A. Tissues were subjected to IHC using a PDI-specific antibody. Representative slides are shown at 40× magnification. B. The relative mean intensity was determined from 6-8 images for each BH (n = 16), DCIS (n = 15) or IBC (n = 22) section and is shown graphically. ANOVA was used to detect statistical differences in the relative expression of BH (p = 0.0003), DCIS (p = 0.0002) and IBC (p = 0.0007) compared to normal mammary tissue, where normal mammary tissue is equal to one (dashed line). C. The relative mean intensity of IBC tissues was graphed according to ERα-status. D. Cellular localization of PDI expression was determined for each tissue section, classified by disease state and shown graphically (N, nuclear; C, cytoplasmic; N+C, nuclear and cytoplasmic).
Figure 8
Figure 8
Expression of NM23-H1 in normal, BH, DCIS and IBC tissue. A. Tissues were subjected to IHC using an NM23-H1-specific antibody. Representative slides are shown at 40× magnification. B. The relative mean intensity was determined from 6-8 images for each BH (n = 16), DCIS (n = 16) or IBC (n = 25) section and is shown graphically. ANOVA was used to detect statistical differences in the relative expression of BH, DCIS (p = 0.0019) and IBC (p < 0.0001) compared to normal mammary tissue, where normal mammary tissue is equal to one (dashed line). C. The relative mean intensity of IBC tissues was graphed according to nodal-status.
Figure 9
Figure 9
Expression of MPG in normal, BH, DCIS and IBC tissue. A. Tissues were subjected to IHC using an MPG-specific antibody. Representative slides are shown at 40× magnification. B. The relative mean intensity was determined from 6-8 images for each BH (n = 16), DCIS (n = 16) or IBC (n = 21) section and is shown graphically. ANOVA was used to detect statistical differences in the relative expression of BH (p = 0.0002), DCIS (p < 0.0001) and IBC (p < 0.0001) compared to normal mammary tissue, where normal mammary tissue is equal to one (dashed line).
Figure 10
Figure 10
Analysis of the DNA lesion, 8-OxoG, in normal, BH, DCIS and IBC tissue. A. Tissues were subjected to IHC using an 8-OxoG-specific antibody. Representative slides are shown at 40× magnification. B. The relative mean intensity was determined from 6-8 images for each BH (n = 15), DCIS (n = 15) or IBC (n = 19) section and is shown graphically. The intensity of normal mammary tissue is equal to one (dashed line). C. The relative mean intensity of IBC tissues was graphed according to ERα-status.
Figure 11
Figure 11
Expression of γ-H2AX in normal, BH, DCIS and IBC tissue. A. Tissues were subjected to IHC using a γ-H2AX-specific antibody. Representative slides are shown at 40× magnification. B. The relative mean intensity was determined from 6-8 images for each BH (n = 16), DCIS (n = 16) or IBC (n = 22) section and is shown graphically. The intensity of normal mammary tissue is equal to one (dashed line).
Figure 12
Figure 12
Expression of the protein damage marker, nitrotyrosine, in normal, BH, DCIS and IBC tissue. A. Tissues were subjected to IHC using a nitrotyrosine-specific antibody. Representative slides are shown at 40× magnification. B. The relative mean intensity was determined from 6-8 images for each BH (n = 13), DCIS (n = 13) or IBC (n = 23) section and is shown graphically. The intensity of normal mammary tissue is equal to one (dashed line).

Similar articles

Cited by

References

    1. Wiechmann LKH. The molecular journey from ductal carcinoma in situ to invasive breast cancer. Cancer. 2008;112(10):2130–2142. doi: 10.1002/cncr.23430. - DOI - PubMed
    1. Jacobs TW, Connolly JL, Schnitt SJ. Nonmalignant lesions in breast core needle biopsies: to excise or not to excise? Am J Surg Pathol. 2002;26(9):1095–1110. doi: 10.1097/00000478-200209000-00001. - DOI - PubMed
    1. Horak CE, Steeg PS. Metastasis gets site specific. Cancer Cell. 2005;8(2):93–95. doi: 10.1016/j.ccr.2005.07.013. - DOI - PubMed
    1. Steeg PS. Tumor metastasis: mechanistic insights and clinical challenges. Nat Med. 2006;12(8):895–904. doi: 10.1038/nm1469. - DOI - PubMed
    1. Harman D. Aging: a theory based on free radical and radiation chemistry. J Gerontol. 1956;11(3):298–300. - PubMed

Publication types

Substances