Comparative Study
. 2010 Jan 11:10:5.
doi: 10.1186/1471-2148-10-5.

Branch length estimation and divergence dating: estimates of error in Bayesian and maximum likelihood frameworks

Affiliations
Comparative Study

Branch length estimation and divergence dating: estimates of error in Bayesian and maximum likelihood frameworks

Rachel S Schwartz et al. BMC Evol Biol. .

Abstract

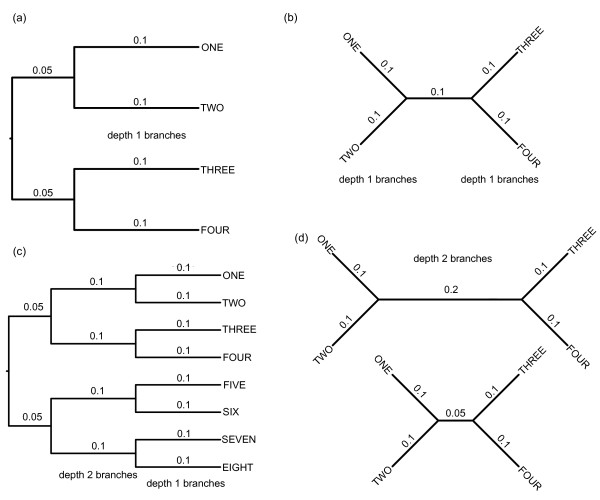
Background: Estimates of divergence dates between species improve our understanding of processes ranging from nucleotide substitution to speciation. Such estimates are frequently based on molecular genetic differences between species; therefore, they rely on accurate estimates of the number of such differences (i.e. substitutions per site, measured as branch length on phylogenies). We used simulations to determine the effects of dataset size, branch length heterogeneity, branch depth, and analytical framework on branch length estimation across a range of branch lengths. We then reanalyzed an empirical dataset for plethodontid salamanders to determine how inaccurate branch length estimation can affect estimates of divergence dates.

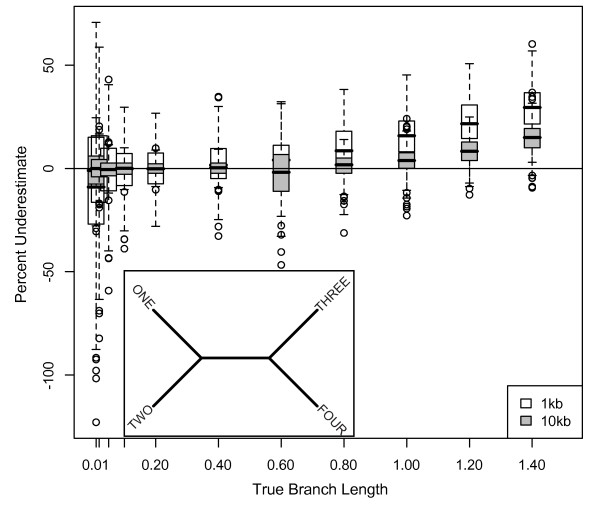
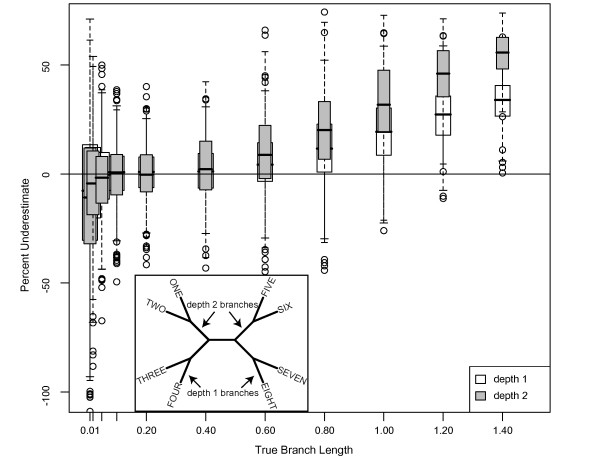
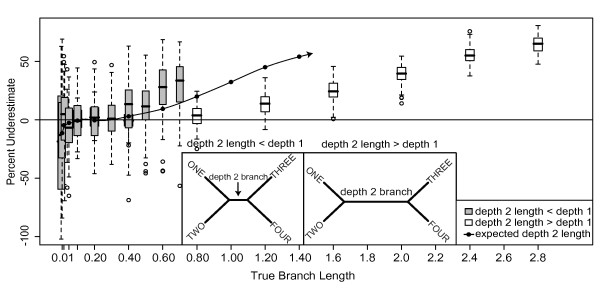
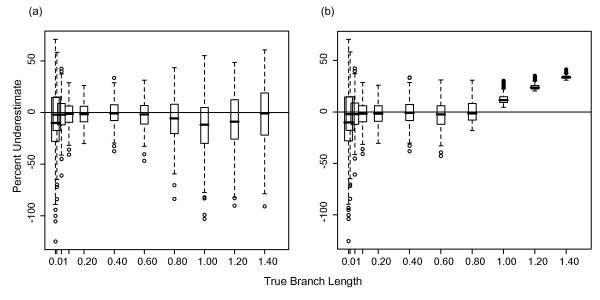
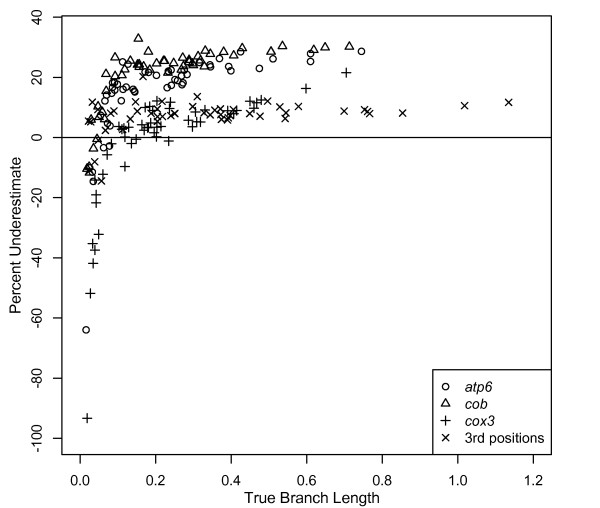
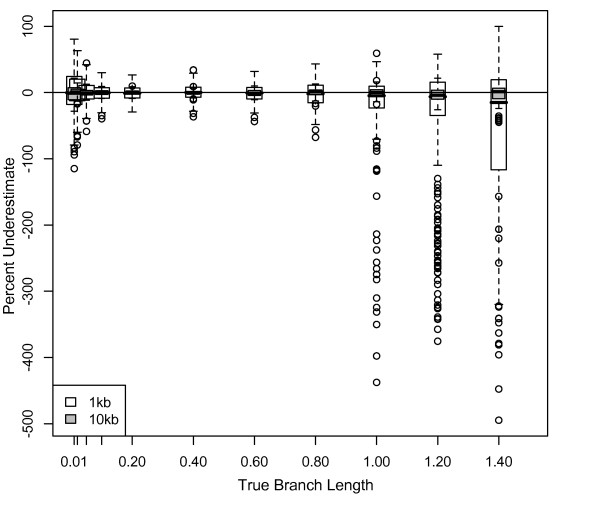
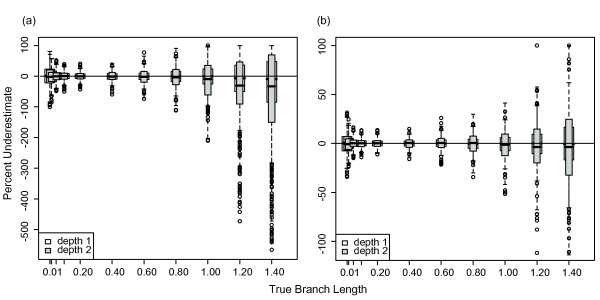
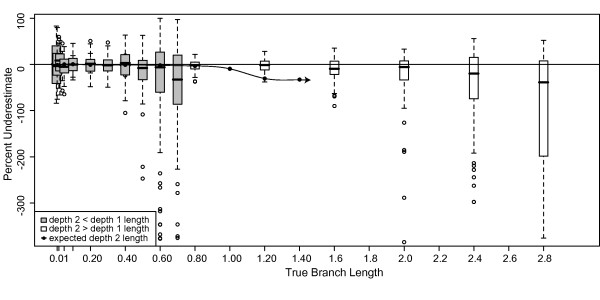
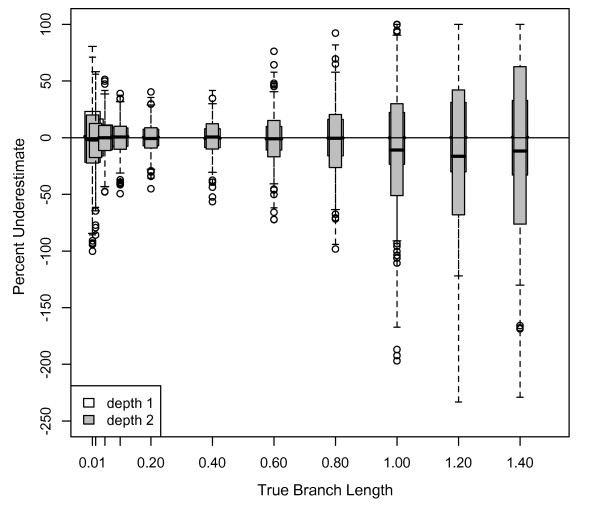
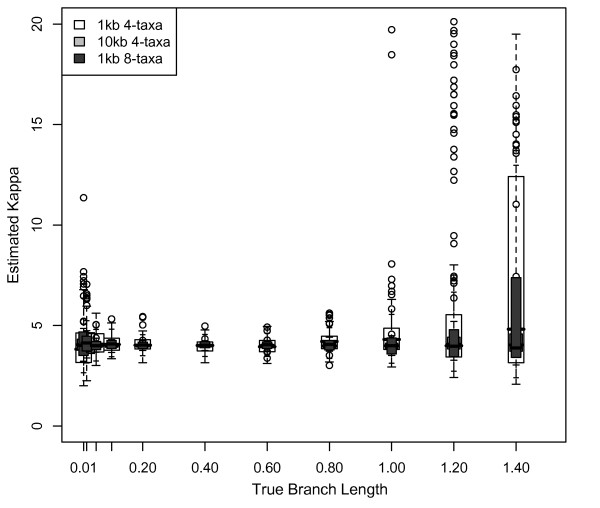
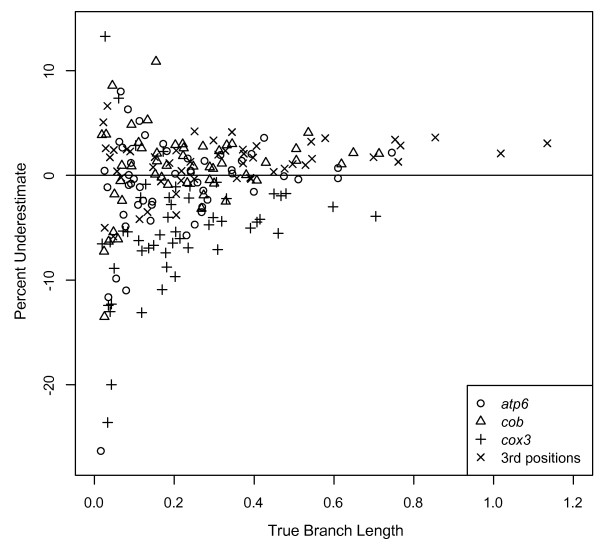
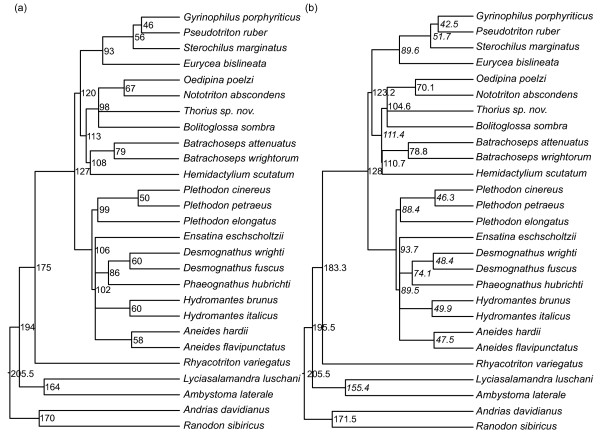
Results: The accuracy of branch length estimation varied with branch length, dataset size (both number of taxa and sites), branch length heterogeneity, branch depth, dataset complexity, and analytical framework. For simple phylogenies analyzed in a Bayesian framework, branches were increasingly underestimated as branch length increased; in a maximum likelihood framework, longer branch lengths were somewhat overestimated. Longer datasets improved estimates in both frameworks; however, when the number of taxa was increased, estimation accuracy for deeper branches was less than for tip branches. Increasing the complexity of the dataset produced more misestimated branches in a Bayesian framework; however, in an ML framework, more branches were estimated more accurately. Using ML branch length estimates to re-estimate plethodontid salamander divergence dates generally resulted in an increase in the estimated age of older nodes and a decrease in the estimated age of younger nodes.

Conclusions: Branch lengths are misestimated in both statistical frameworks for simulations of simple datasets. However, for complex datasets, length estimates are quite accurate in ML (even for short datasets), whereas few branches are estimated accurately in a Bayesian framework. Our reanalysis of empirical data demonstrates the magnitude of effects of Bayesian branch length misestimation on divergence date estimates. Because the length of branches for empirical datasets can be estimated most reliably in an ML framework when branches are <1 substitution/site and datasets are > or =1 kb, we suggest that divergence date estimates using datasets, branch lengths, and/or analytical techniques that fall outside of these parameters should be interpreted with caution.


Figures

Figure 1
Figure 1
Example trees used in simulations. (a) Balanced 4-taxon trees with equal branch lengths used for basic data simulations. This tree shows one of the 11 sets of branches of different lengths. (b) Unrooted version of the tree in (a) used for branch length estimation. When the tree is unrooted it is clear that all branches are of equal length. (c) Balanced 8-taxon trees of equal branch lengths used to determine whether branch length estimation is affected by (1) the depth of the branch in the tree, and (2) the number of taxa. (d) Balanced 4-taxon trees with equal depth 1 branch lengths and the depth 2 branch half or double the length of the depth 1 branches. These trees were used for simulations to determine whether interactions among branch lengths affect branch length estimation accuracy.
Figure 2
Figure 2
Underestimate of Bayesian branch lengths for 4-taxon trees. Percentage that branch lengths were underestimated for 1 and 10 kb datasets simulated on 4-taxon trees with equal branch lengths (inset) using the HKY model with a transition/transversion ratio of 2 and equal base frequencies, and analyzed using MrBayes with an HKY model, estimated model parameters, and the default exponential prior (mean = 0.1) on branch lengths. The box plot shows the range of misestimation across all branches and simulations; results were identical for single branches and total tree length.
Figure 3
Figure 3
Underestimate of Bayesian branch lengths for 8-taxon trees. Percentage that branch lengths were underestimated for 1 kb datasets simulated on 8-taxon trees with equal branch lengths (inset) using the HKY model with a transition/transversion ratio of 2 and equal base frequencies, and analyzed using MrBayes with an HKY model, estimated model parameters, and the default exponential prior (mean = 1/10) on branch lengths. Branches with depth = 1 and depth = 2 (see inset) were evaluated separately (white and gray boxes, respectively).
Figure 4
Figure 4
Underestimate of Bayesian branch lengths on unequal branch length trees. Effects of unequal branch lengths on branch length estimation. Gray boxes are the percent underestimation of depth 2 branch lengths for 4-taxon trees with the depth 2 branch length = half the depth 1 branch length (left inset). White boxes are the percent underestimation of depth 2 branch lengths for 4-taxon trees with the depth 2 branch length = double the depth 1 branch length (right inset). Depth 2 branch lengths were expected to be underestimated at the same rate as depth 2 branch lengths of 8-taxon, equal-branch-length datasets (mean underestimation shown as filled circles). Half-length depth 2 branches (gray boxes) were underestimated at a significantly higher rate than expected (filled circles). Double-length depth 2 branches (white boxes) were underestimated at a rate significantly lower than expected (filled circles and extrapolating from the trend of underestimation (spline interpolation line)). The range of depth 2 branch lengths examined in this analysis was dictated by the range of depth 1 branch lengths examined in the overall study (0.01-1.4 substitutions/site).
Figure 5
Figure 5
Underestimate of Bayesian branch lengths with different branch length priors. (a) Percentage that branch lengths were underestimated for 1 kb datasets simulated on 4-taxon trees with equal branch lengths using the HKY model with a transition/transversion ratio of 2 and equal base frequencies, and analyzed using MrBayes with an exponential prior on branch lengths of mean = 1. (b) Identical to (a) but analyzed with a uniform prior on branch lengths (bounds of 0-1).
Figure 6
Figure 6
Estimates of parameters in Bayesian analysis. The estimated transition:transversion rate ratio (kappa) as a function of branch length. Kappa used for simulations was 4 (transition:transversion = 2, equal base frequencies, twice as many transitions as transversions). Kappa was estimated from the data in a Bayesian framework using MrBayes with the default exponential branch length prior (mean = 0.1) for 4-taxon, equal-branch-length, HKY 1 kb datasets (white boxes); with the default exponential branch length prior for 4-taxon, equal-branch-length, HKY 10 kb datasets (gray boxes); and with an exponential branch length prior of mean = 1 for 4-taxon, equal branch length, HKY 1 kb datasets (dark gray boxes).
Figure 7
Figure 7
Underestimate of Bayesian branch lengths using empirical parameters. Percentage that branch lengths were underestimated for data simulated using empirical parameters for the mitochondrial genes atp6, cob, and cox3, as well as 3rd codon positions for all 13 mitochondrial protein coding genes on the plethodontid salamander phylogeny of Mueller et al. (2004). Data were analyzed in a Bayesian framework using MrBayes to determine the effects of biologically realistic, unequal branch lengths on branch length estimation. For clarity, only the mean underestimate for each branch across simulations is shown.
Figure 8
Figure 8
Underestimate of ML branch lengths for 4-taxon trees. Percentage that branch lengths were underestimated for 1 and 10 kb datasets simulated on 4-taxon trees with equal branch lengths using the HKY model with a transition/transversion ratio of 2 and equal base frequencies, and analyzed using maximum likelihood with parameters estimated from the data. This analysis is equivalent to that of Figure 2, but conducted using an ML framework; refer to the Figure 2 inset for the simulation topology.
Figure 9
Figure 9
Underestimate of ML branch lengths for 8-taxon trees. Percentage that branch lengths were underestimated for datasets simulated on 8-taxon trees with equal branch lengths using the HKY model with a transition/transversion ratio of 2 and equal base frequencies, and analyzed using maximum likelihood with parameters estimated from the data. Depth 1 and depth 2 branches were graphed separately (white and gray boxes respectively. This analysis is equivalent to that of Figure 3, but conducted using an ML framework; refer to the Figure 3 inset for the simulation topology. (a) 1 kb datasets; (b) 10 kb datasets. Outliers (not shown) for depth 2 branches of 1.2 substitutions/site for 1 kb datasets were up to 30,000% overestimated (negatively underestimated) and were up to 50,000% overestimated for branch lengths of 1.4 substitutions/site.
Figure 10
Figure 10
Underestimate of ML branch lengths on unequal branch length trees. Effects of unequal branch lengths on branch length estimation in a maximum likelihood framework. Results are plotted as for Figure 4. Gray boxes are the percent underestimation of depth 2 branch lengths for 4-taxon trees with the depth 2 branch length = half the depth 1 branch length. White boxes are the percent underestimation of depth 2 branch lengths for 4-taxon trees with the depth 2 branch length = double the depth 1 branch length (outliers of up to -30000% for branches of 1.4 substitutions/site are not shown for clarity). Depth 2 branch lengths were expected to be underestimated at the same rate as depth 2 branch lengths of 8-taxon equal-branch-length datasets (mean underestimation shown as filled circles). Half-length depth 2 branches (gray boxes) were generally overestimated (negatively underestimated) at a higher rate than expected (filled circles). Double-length depth 2 branches (white boxes) were overestimated at a lower rate than expected (filled circles and extrapolating from the trend of underestimation (spline interpolation line)).
Figure 11
Figure 11
Underestimate of ML branch lengths with fixed parameters. Percentage that branch lengths were underestimated for 1 kb datasets simulated on 8-taxon trees with equal branch lengths using the HKY model with a transition/transversion ratio of 2 and equal base frequencies, and analyzed using maximum likelihood with fixed model parameters, Depth 1 and depth 2 branches are shown separately (white and gray boxes respectively). Open circles are outliers.
Figure 12
Figure 12
Estimates of parameters in ML analysis. The estimated transition:transversion rate ratio (kappa) plotted against branch length. Kappa was estimated from the data in an ML framework using PAUP* for 4-taxon equal-branch-length HKY datasets of 1 and 10 kb, and for 8-taxon datasets of 1 kb. Kappa used for simulations was 4 (transition:transversion = 2, equal base frequencies, twice as many transitions as transversions). This analysis is equivalent to that of Figure 6, but conducted using an ML framework.
Figure 13
Figure 13
Underestimate of ML branch lengths using empirical parameters. Percentage that branch lengths were underestimated for data simulated using empirical parameters for the mitochondrial genes atp6, cob, and cox3, as well as the 3rd codon positions for the 13 mitochondrial protein coding genes on the plethodontid salamander phylogeny of Mueller et al. (2004). Data were analyzed in an ML framework using PAUP* to determine the effects of biologically realistic, unequal branch lengths on branch length estimation. For clarity, only the mean underestimate for each branch across simulations is shown. This analysis is equivalent to that of Figure 7, but conducted using an ML framework.
Figure 14
Figure 14
Change in divergence date estimates for plethodontid salamanders following re-estimation of branch lengths using ML. (a) Divergence dates for plethodontid salamanders estimated by Mueller (2006) using penalized likelihood, with branch lengths estimated using a Bayesian framework. (b) Divergence dates estimated in this study using penalized likelihood, with branch lengths estimated using ML. Italicized dates were estimated as younger than in the original analysis. Non-italicized dates were estimated as the same age or older than in the original analysis.

Similar articles

Cited by

References

    1. Benton MJ, Ayala FJ. Dating the tree of life. Science. 2003;300(5626):1698–1700. doi: 10.1126/science.1077795. - DOI - PubMed
    1. Hedges SB, Blair JE, Venturi ML, Shoe JL. A molecular timescale of eukaryote evolution and the rise of complex multicellular life. BMC Evol Biol. 2004;4:2. doi: 10.1186/1471-2148-4-2. - DOI - PMC - PubMed
    1. Guillet-Claude C, Isabel N, Pelgas B, Bousquet J. The evolutionary implications of knox-I gene duplications in conifers: correlated evidence from phylogeny, gene mapping, and analysis of functional divergence. Mol Biol Evol. 2004;21(12):2232–2245. doi: 10.1093/molbev/msh235. - DOI - PubMed
    1. Allen JM, Light JE, Perotti MA, Braig HR, Reed DL. Mutational meltdown in primary endosymbionts: selection limits Muller's ratchet. PLoS ONE. 2009;4(3):e4969. doi: 10.1371/journal.pone.0004969. - DOI - PMC - PubMed
    1. Pennington RT, Lavin M, Prado DE, Pendry CA, Pell SK, Butterworth CA. Historical climate change and speciation: neotropical seasonally dry forest plants show patterns of both tertiary and quaternary diversification. Philos Trans R Soc Lond B Biol Sci. 2004;359(1443):515–537. doi: 10.1098/rstb.2003.1435. - DOI - PMC - PubMed

Publication types

LinkOut - more resources