

Modelling imperfect adherence to HIV induction therapy
- PMID: 20064271
- PMCID: PMC2833165
- DOI: 10.1186/1471-2334-10-6
Modelling imperfect adherence to HIV induction therapy
Abstract
Background: Induction-maintenance therapy is a treatment regime where patients are prescribed an intense course of treatment for a short period of time (the induction phase), followed by a simplified long-term regimen (maintenance). Since induction therapy has a significantly higher chance of pill fatigue than maintenance therapy, patients might take drug holidays during this period. Without guidance, patients who choose to stop therapy will each be making individual decisions, with no scientific basis.
Methods: We use mathematical modelling to investigate the effect of imperfect adherence during the inductive phase. We address the following research questions: 1. Can we theoretically determine the maximal length of a possible drug holiday and the minimal number of doses that must subsequently be taken while still avoiding resistance? 2. How many drug holidays can be taken during the induction phase?
Results: For a 180 day therapeutic program, a patient can take several drug holidays, but then has to follow each drug holiday with a strict, but fairly straightforward, drug-taking regimen. Since the results are dependent upon the drug regimen, we calculated the length and number of drug holidays for all fifteen protease-sparing triple-drug cocktails that have been approved by the US Food and Drug Administration.
Conclusions: Induction therapy with partial adherence is tolerable, but the outcome depends on the drug cocktail. Our theoretical predictions are in line with recent results from pilot studies of short-cycle treatment interruption strategies and may be useful in guiding the design of future clinical trials.
Figures
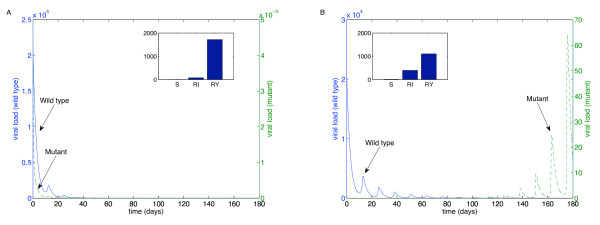
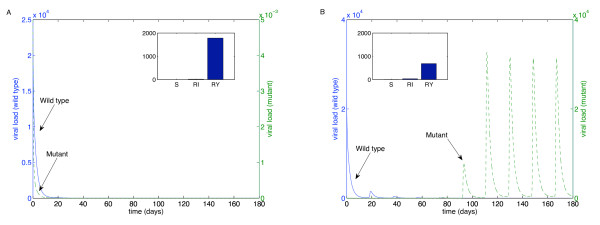
 to upper endpoints
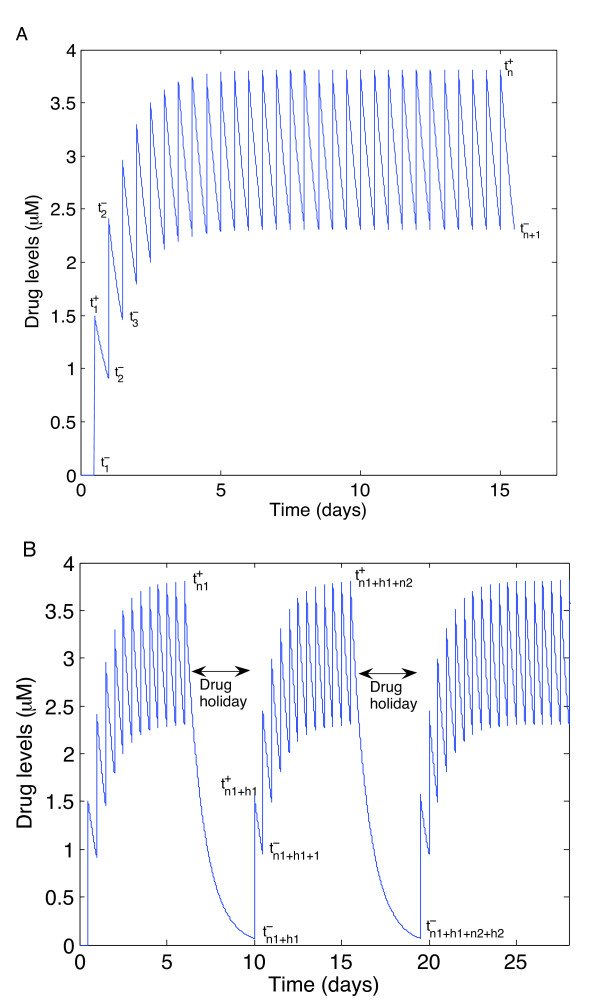
  . Drug concentration levels increase instantaneously after a dose is taken and decrease exponentially between doses. If all doses are taken, drug concentration levels monotonically approach an impulsive orbit. B. Example of fluctuating drug concentration levels when missing drug doses. Once drug concentration levels have reached the impulsive orbit
  , missing h doses results in a long exponential decay. Subsequent adherence returns drug concentration levels to the impulsive periodic orbit before the next drug holiday occurs
  . In this example, a patient has two drug holidays within a 30 day period.
References
-
- Yeni PG, Hammer SM, Hirsch M, Saag M, Schechter M, Carpenter CCJ, Fischi MA, Gatell JM, Gazzard BG, Jacobsen D, Katzenstein DA, Montaner JSG, Richman DD, Schooley RT, Thompson MA, Vella S, Volberding PA. Treatment for adult HIV infection: 2004 recommendations of the International AIDS Society - USA Panel. JAMA. 2004;292:251–265. doi: 10.1001/jama.292.2.251. - DOI - PubMed
-
- Staszewski S, Morales-Ramirez J, Tashima KT, Rachlis A, Skiest D, Stanford J, Stryker R, Johnson P, Labriola DF, Farina D, Manion DJ, Ruiz NM. Efavirenz plus zidovudine and lamivudine, efavirenz plus indinavir and indinavir plus zidovudine and lamivudine in the treatment of HIV-1 infection in adults. N Engl J Med. 1999;341:1865–1873. doi: 10.1056/NEJM199912163412501. - DOI - PubMed
-
- Moyle G. Protease inhibitor-sparing regimens: new evidence strengthens position. J Acq Immun Def Synd. 2003;33(Suppl 1):17–25. - PubMed
Publication types
MeSH terms
Substances
LinkOut - more resources
Full Text Sources
Medical
