. 2009 Dec 24;64(6):807-27.
doi: 10.1016/j.neuron.2009.11.006.

Leucine-rich repeat kinase 2 regulates the progression of neuropathology induced by Parkinson's-disease-related mutant alpha-synuclein

Affiliations

Leucine-rich repeat kinase 2 regulates the progression of neuropathology induced by Parkinson's-disease-related mutant alpha-synuclein

Xian Lin et al. Neuron. .

Abstract

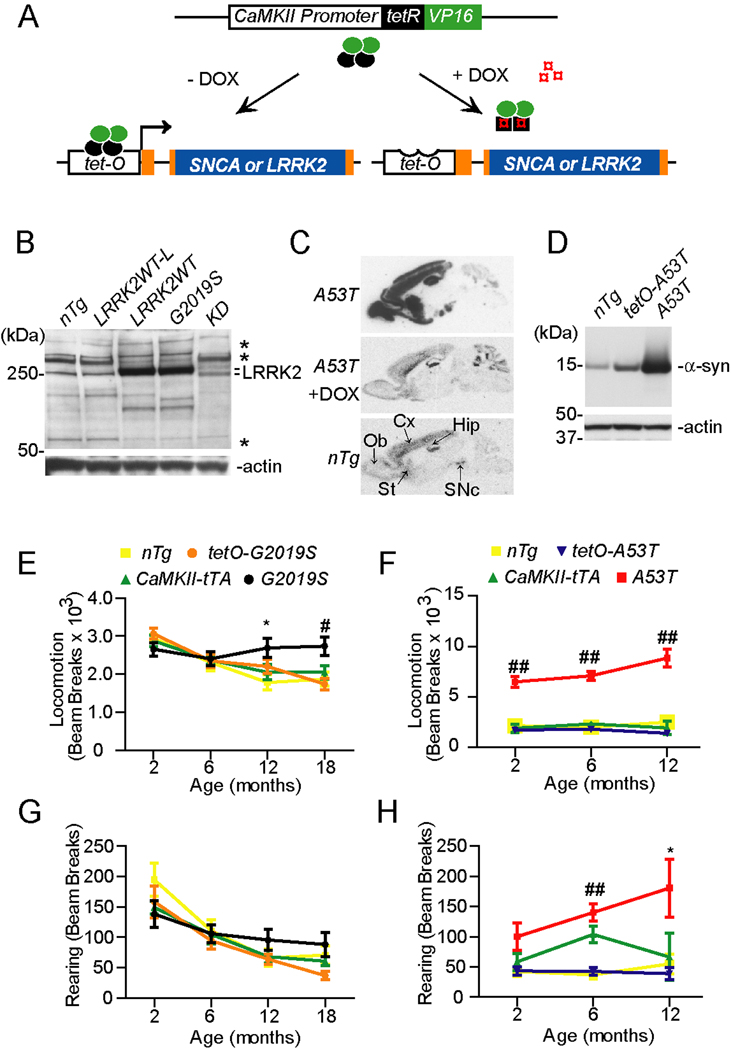
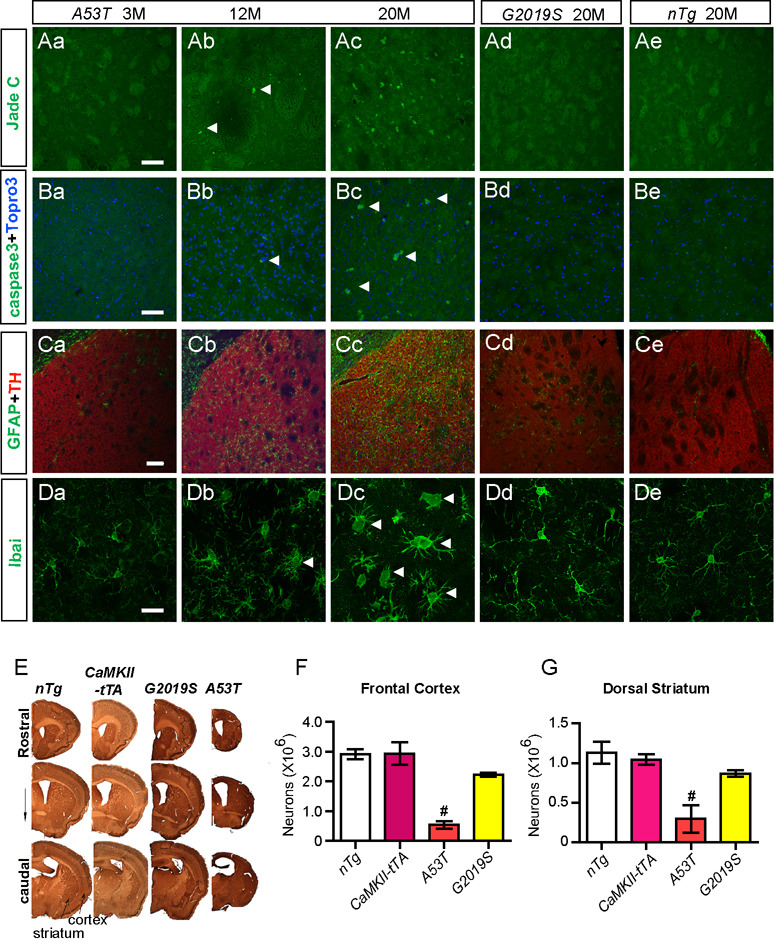
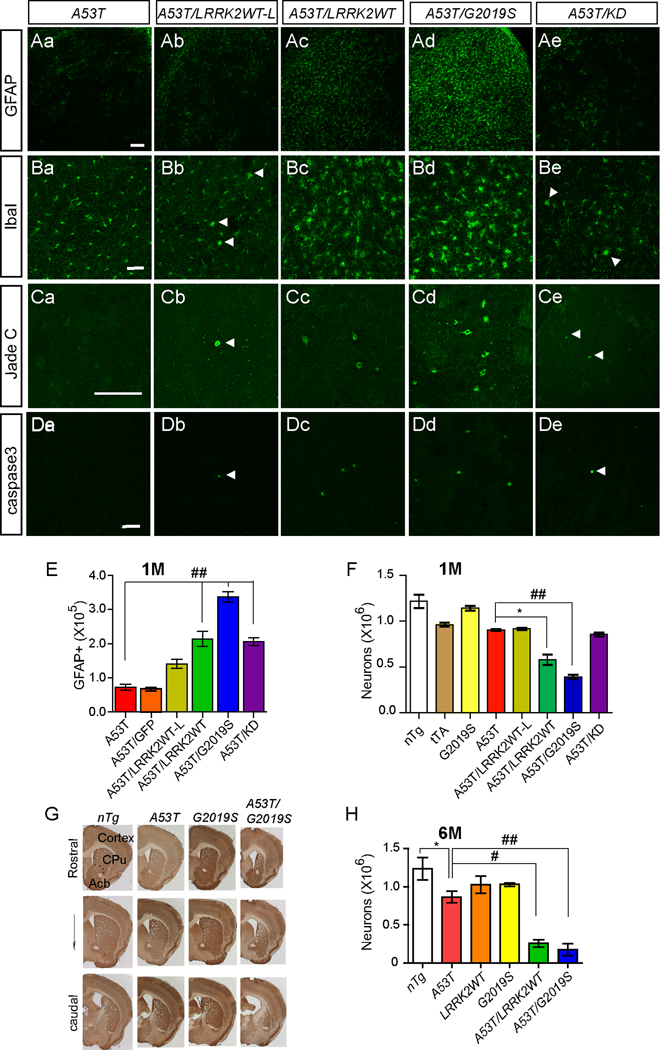
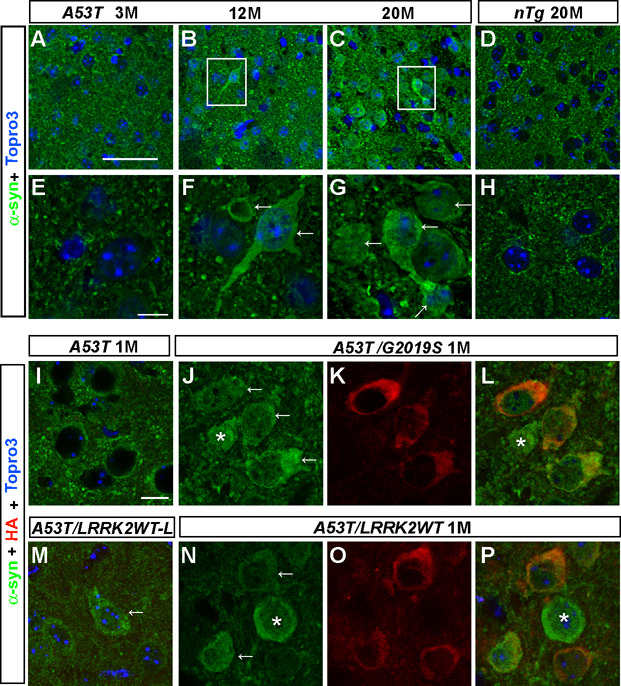
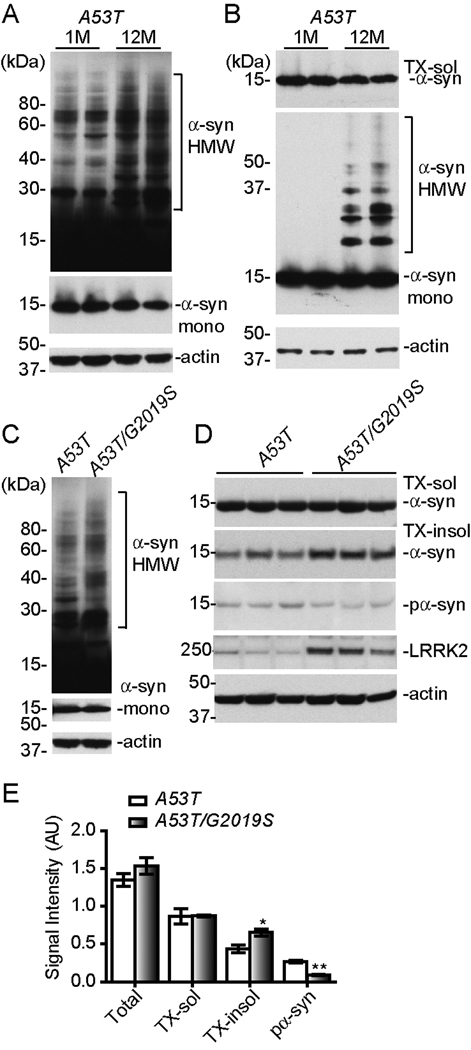
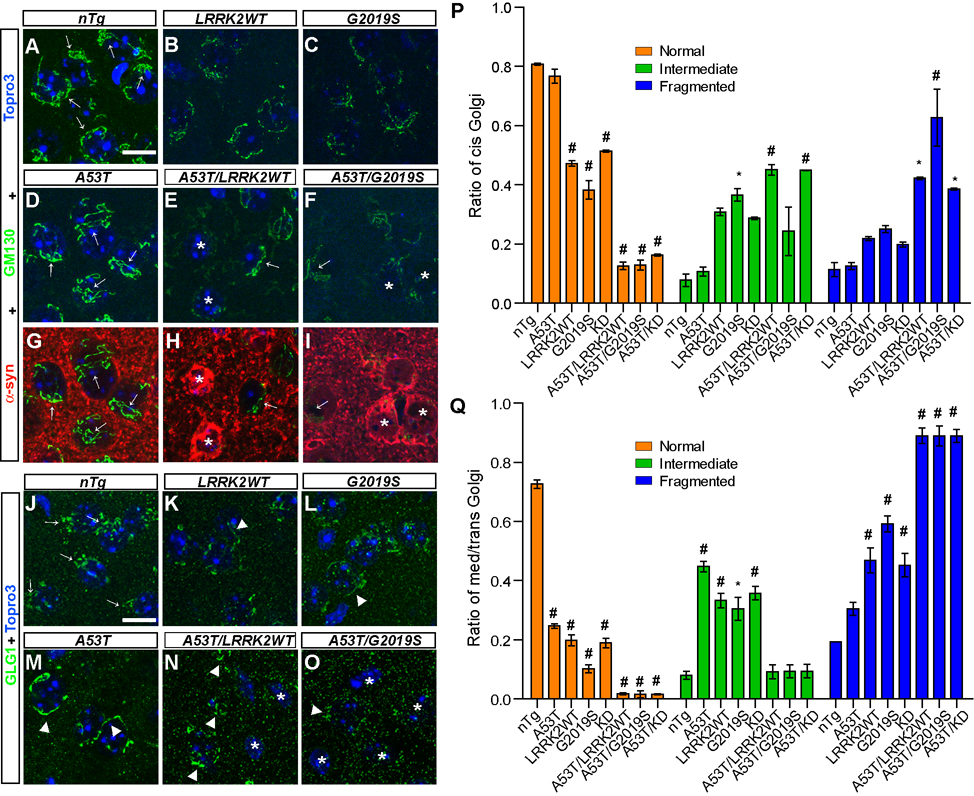
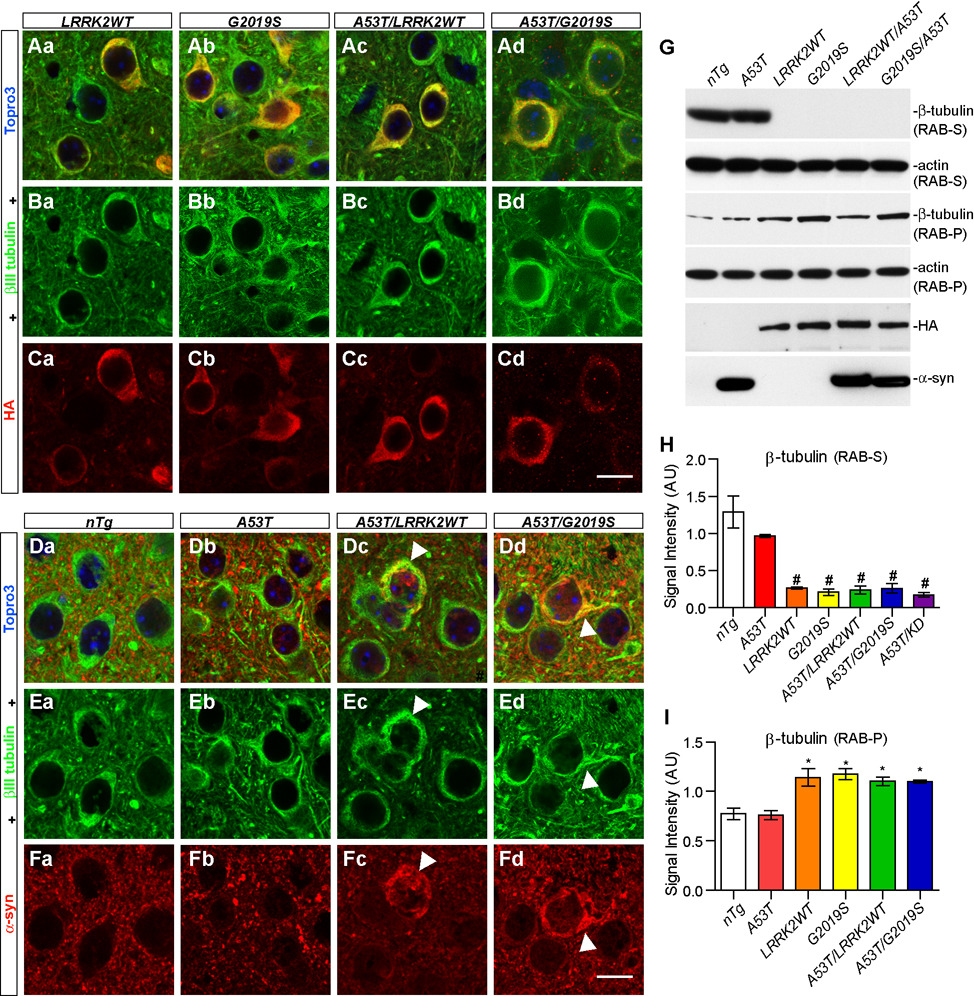
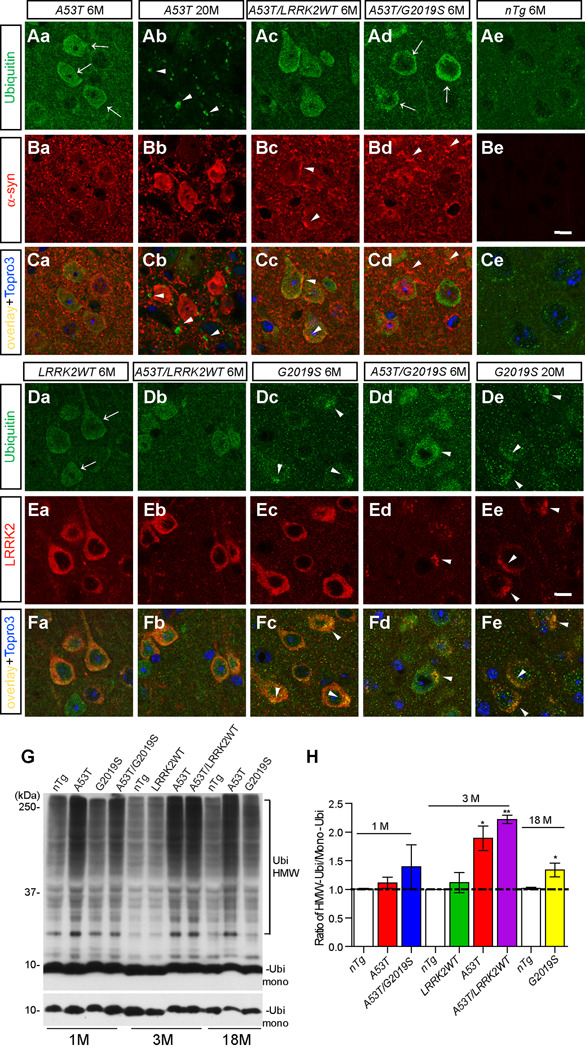
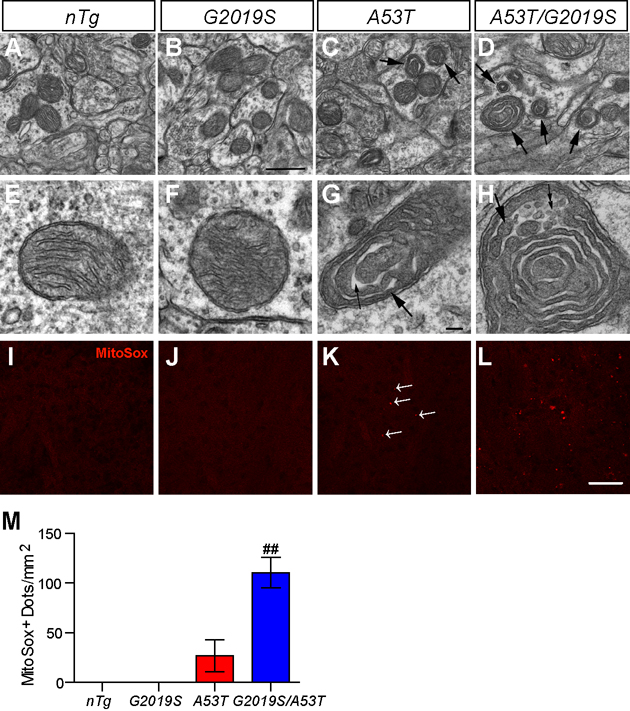
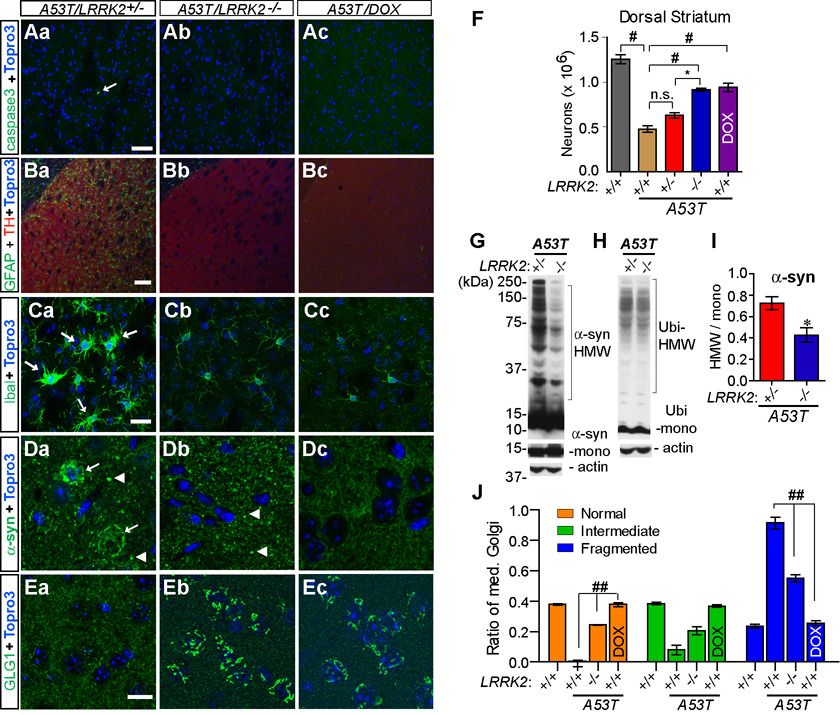
Mutations in alpha-synuclein and Leucine-rich repeat kinase 2 (LRRK2) are linked to autosomal dominant forms of Parkinson's disease (PD). However, little is known about any potential pathophysiological interplay between these two PD-related genes. Here we show in transgenic mice that although overexpression of LRRK2 alone did not cause neurodegeneration, the presence of excess LRRK2 greatly accelerated the progression of neuropathological abnormalities developed in PD-related A53T alpha-synuclein transgenic mice. Moreover, we found that LRRK2 promoted the abnormal aggregation and somatic accumulation of alpha-synuclein in A53T mice, which likely resulted from the impairment of microtubule dynamics, Golgi organization, and the ubiquitin-proteasome pathway. Conversely, genetic ablation of LRRK2 preserved the Golgi structure and suppressed the aggregation and somatic accumulation of alpha-synuclein, and thereby delayed the progression of neuropathology in A53T mice. These findings demonstrate that overexpression of LRRK2 enhances alpha-synuclein-mediated cytotoxicity and suggest inhibition of LRRK2 expression as a potential therapeutic option for ameliorating alpha-synuclein-induced neurodegeneration.


Conflict of interest statement

Conflict of interest statement: There is no competing financial interest of all researchers involved in this work.

Figures

Figure 1
Figure 1. Generation and behavioral characterization of LRRK2 andα-syn inducible transgenic mice
(A) The schematic diagram shows the generation of α-syn and LRRK2 inducible transgenic mice using the “tet off” system. (B) Western blot analysis shows LRRK2 expression in the brain of nTg, LRRK2WT-L, LRRK2WT, G2019S, and KD transgenic mice using a LRRK2 C-terminal antibody. Asterisks marked non-specific bands. LRRK2 appeared as doublet in KD sample. (C) The expression pattern of A53T α-syn transgene in the brain by in situ hybridization using a P33-labeled human/mouse α-syn-specific oligo probe (upper panel). The expression of transgenic α-syn was suppressed by administering the animals with doxycycline (DOX)-containing feed for 4 wks (middle panel). The endogenous α-syn was also highly expressed by SNpc DA neurons (bottom panel). Ob: olfactory bulb; Cx: cortex; St: Striatum; Hip: hippocampus; SNpc: substantia nigra pars compacta. (D) Western blots of α-syn expression in the brain of nTg, tetO-A53T, and A53T transgenic mice using an antibody recognizing both mouse and human α-syn. (E, G) The nTg (n = 10), tetO-G2019S (n = 10), CaMKII-tTA (n = 14), and G2019S (n = 12) mice were subjected to Open-field tests. The ambulatory (E) and rearing activities (G) were quantified in the Open-field test. *p<0.05, #p<0.005 (F, H) A53T transgenic and control mice were subjected to Open-field test to evaluate their ambulatory (F) and rearing (H) activities. n =10 per genotype. *p<0.05, ##p<0.001
Figure 2
Figure 2. A53T but not G2019S transgenic mice develop progressive neuropathology
(Aa–Ae) Representative images show Jade C staining (arrowheads) in the striatum of A53T mice at 3 (a), 12 (b), and 20 (c) months of age, and of G2019S (d) and control nTg (e) mice at 20 months of age. Scale bar: 50 µm (Ba–Be) Representative images show cleaved-caspase 3 (caspase3) staining (white arrowheads) in the striatum of A53T mice at 3 (a), 12 (b), and 20 (c) months of age, and of G2019S (d) and control nTg (e) mice at 20 months of age. Nuclei were stained with Topro 3 (blue). Scale bar: 50 µm (Ca–Ce) Representative images reveal GFAP staining (green) in the striatum of A53T mice at 3 (a), 12 (b), and 20 (c) months of age, and of G2019S (d) and control nTg (e) mice at 20 months of age. The section was counter-stained with an antibody against tyrosine hydroxylase (TH) (red). Scale bar: 100 µm (Da–De) Representative images show Iba1 staining (green) in the striatum of A53T mice at 3 (a), 12 (b), and 20 (c) months of age, and of G2019S (d) and control nTg (e) mice at 20 months of age. Scale bar: 20 µm (E) Representative images display coronal sections co-stained with NeuN and TH across the striatum of 20-month old nTg, CaMKII-tTA, G2019S, and A53T mice. (F–G) Bar graphs depict the numbers of neurons remained the frontal cortex (F) and dorsal striatum (G) of 20-month old nTg, CaMKII-tTA, G2019S, and A53T mice. #p < 0.005 vs. nTg
Figure 3
Figure 3. LRRK2 accelerates the progression of A53 α-syn-mediated neuropathology
(Aa–Ae) Representative images show GFAP staining in the striatum of 1-month old A53T (a), A53T/LRRK2WT-L (b), A53T/LRRK2WT (c), A53T/G2019S (d), and A53T/KD (e) mice. Scale bar: 100 µm (Ba–Be) Representative images show Iba1 staining in the striatum of 1-month old A53T (a), A53T/LRRK2WT-L (b), A53T/LRRK2WT (c), A53T/G2019S (d), and A53T/KD (e) mice. Scale bar: 50 µm (Ca–Ce) Representative images show Jade C staining in the striatum of 1-month old A53T (a), A53T/LRRK2WT-L (b), A53T/LRRK2WT (c), A53T/G2019S (d), and A53T/KD (e) mice. Scale bar: 20 µm (Da–De) Representative images show caspase3 staining in the striatum of 1-month old A53T (a), A53T/LRRK2WT-L (b), A53T/LRRK2WT (c), A53T/G2019S (d), and A53T/KD (e) mice. Scale bar: 50 µm (E–F) Bar graphs reveal the numbers of GFAP-positive (GFAP+, E) and NeuN-positive cells (F) in the dorsal striatum estimated by unbiased stereological methods. *p < 0.05, ##p < 0.001 (G) Representative images show coronal sections across the striatum of 6-month old nTg, A53T, G2019S, A53T/G2019S mice. The section was co-stained with NeuN and TH. (H) Bar graph depicts the numbers of neurons remained the dorsal striatum (G) of 6-month old nTg, A53T, LRRK2WT, G2019S, A53T/LRRK2WT and A53T/G2019S mice. *p < 0.05, #p < 0.005, ##p < 0.001
Figure 4
Figure 4. LRRK2 accelerates somatic accumulation of A53T α-syn in neurons
(A–H) Representative images show α-syn staining (green) in striatal neurons of A53T mice at 3 (A), 12 (B), and 20 months of age (C), and nTg mice at 20 months of age (D). F and G represent enlarged images with the white boxes in B and C. Nuclei were stained with Topro 3 (blue). Scale bars: 50 µm (A–D); 10 µm (E–H). (I–P) Representative images reveal α-syn staining (green) in striatal neurons of 1-month old A53T (I), A53T/G2019S (J, L), A53T/LRRK2WT-L (M), and A53T/LRRK2WT (N, P) mice. Human LRRK2 was stained with an anti-HA antibody (red, K–L, O–P). Nuclei were stained with Topro 3 (blue). Scale bar: 10 µm.
Figure 5
Figure 5. LRRK2 promotes the formation of α-syn Aggregates
(A–B) Western blots show high molecular weight (HMW) bands of α-syn in the total (A) and sequentially detergent-extracted (B) brain homogenates of A53T transgenic mice at 1 and 12 months of age. The middle panel in (A) shows the monomeric α-syn (α-syn mono) under lower exposure. (C) Western blots show α-syn-positive HMW bands in the total brain homogenates of A53T single and A53T/G2019S double transgenic mice at 1 month of age. The middle panel in (C) shows the monomeric α-syn with shorter exposure. (D) Western blots show phosphorylated α-syn (pα-syn) in the total and monomeric α-syn in sequentially detergent-extracted fractions of brain homogenates of A53T single and A53T/G2019S double transgenic mice at 1 month of age. (E–F) Bar graphs compare the levels of α-syn and pα-syn in different fractions of brain homogenates (E) of A53T and A53T/G2019S transgenic mice at 1 month of age. *p<0.05, **p<0.01
Figure 6
Figure 6. α-syn and LRRK2 cause synergistic damage to Golgi apparatus
(A–I) Representative images show GM130 staining (arrows, green) in the striatum of nTg (A), LRRK2WT (B), G2019S (C), A53T (D, G), A53T/LRRK2WT (E, H) and A53T/G2019S (F, I) mice at 1 month of age. Co-staining of GM130 (green) and α-syn (red) was shown in the striatum of A53T (G), A53T/LRRK2WT (H) and A53T/G2019S (I) mice. Neurons displaying somatic accumulation of α-syn were marked with asterisks. Normal GM130 staining was pointed by arrows in neurons. Nuclei were labeled by Topro 3 staining (blue). Scale bar: 10 µm (J–O) Representative images show GLG1 staining (green) in the striatum of nTg (J), LRRK2WT (K), G2019S (L), A53T (M), A53T/LRRK2WT (N) and A53T/G2019S (O) mice at 1 month of age. Normal GLG1 staining was pointed by arrows in neurons; and abnormal tubular and fragmented GLG1 staining was marked by arrowheads. Neurons with complete fragmentation of Golgi were marked with asterisk. Nuclei were labeled by Topro 3 staining (blue). Scale bar: 10 µm. (P–Q) Bar graphs quantify the morphological changes of cis- (P) and trans- (Q) Golgi in neurons (> 300 neurons and ≥ 3 mice per genotype). *p < 0.05, #p < 0.0005
Figure 7
Figure 7. Over-expression of LRRK2 impairs the dynamics of microtubules
(A–C) Representative images show βIII tubulin (green) and HA (red) staining in the striatum of LRRK2WT (Aa, Ba, and Ca), G2019S (Ab, Bb, and Cb), A53T/LRRK2WT (Ac, Bc, and Cc) and A53T/G2019S (Ad, Bd, and Cd) mice at 1 month of age. Nuclei were labeled by Topro 3 staining (blue). Scale bar: 10 µm. (D–F) Representative images show βIII tubulin (green) and α-syn (red) staining in the striatum of nTg (Da, Ea, and Fa), A53T (Db, Eb, and Fb), A53T/LRRK2WT (Dc, Ec, and Fc) and A53T/G2019S (Dd, Ed, and Fd) mice at 1 month of age. The abnormal somatic accumulation of α-syn and βIII tubulin was marked by arrowheads. Nuclei were labeled by Topro 3 staining (blue). Scale bar: 10 µm. (G) Western blots of β-tubulin in RAB buffer-soluble supernatant (RAB-S) and insoluble pellet (RAB-P) fractions of brain homogenates from various transgenic mice at 1 month of age and age-matched nTg controls. (H–I) Bar graphs quantify the levels of β- tubulin in RAB-S (H) and RAB-P (I) fractions of brain homogenates of transgenic mice at 1 month of age and age-matched nTg controls. *p < 0.05, ##p < 0.001
Figure 8
Figure 8. Over-expression of A53T and LRRK2 impairs the UPS activities in neurons
(A–C) Representative images show Ubi staining (arrows, green) in the cortex of A53T mice at 6 (Aa) and 20 (Ab) months of age, and A53T/LRRK2WT (Ac), A53T/G2019S (Ad), and nTg (Ae) mice at 6 months of age. Images from Ba to Be display corresponding α-syn staining (red); while images from Ca to Ce show the overlay of Ubi and α-syn staining. Nuclei were labeled by Topro 3 staining (blue). Scale bar: 10 µm (D–F) Representative images show Ubi staining (arrows, green) in the cortex of LRRK2WT (Da) and A53T/LRRK2WT (Db) mice at 6 months of age; G2019S (Dc) and A53T/G2019S (Dd) mice at 6 and G2019S mice at 20 (De) months of age. Images from Ea to Ee display corresponding LRRK2 staining (red); whilst images from Fa to Fe show the overlay of Ubi and LRRK2 staining. Nuclei were labeled by Topro 3 staining (blue). (G) Western blots show Ubi-positive HMW bands in the total brain homogenates of nTg, A53T, G2019S, and A53T/G2019S mice at 1 month of age; nTg, LRRK2WT, A53T, and A53T/LRRK2WT mice at 3 months of age; and nTg, A53T, and G2019S mice at 18 months of age. The bottom panel in (G) shows the level of monomeric Ubi (Ubi mono) with shorter exposure. (H) Bar graph shows the ratio of HMW/mono-Ubi in the total brain homogenates of mice with different genotype at 1, 3, 18 months of age. *p<0.05, **p<0.01
Figure 9
Figure 9. LRRK2 exacerbates α-syn-induced mitochondrial structural and functional abnormalities
(A–H) Representative EM images show mitochondria in the striatum of nTg (A, E), G2019S (B, F), A53T (C, G), and A53T/G2019S (D, H) transgenic mice at 1 month of age. The abnormal mitochondria were marked by arrows (C, D). The dense matrix of the abnormal mitochondria in G and H often appear “sausage-like” with multiple constrictions (large arrows in G, H) and concentric in arrangement, and occasionally became vesiculated (small double arrows in H). N = 2 per genotype. Scale bar: 0.5 µm (A–D); 0.1 µm (E–H). (I–L) Representative images show the MitoSox Red staining in the striatum of nTg (I), G2019S (J), A53T (K), and A53T/G2019S (L) mice at 1 month of age. Scale bar: 50 µm. (M) Bar graph shows the quantification of MitoSox Red staining shown in I–L. ##p < 0.001
Figure 10
Figure 10. Inhibition of LRRK2 delays the progression of A53T α-syn-mediated neuropathology and reduces the somatic accumulation and aggregation of α-syn
(Aa–Ec) Representative images show caspase3 (Aa–Ac), GFAP (Ba–Bc), Iba1 (Ca–Cc), α-syn (Da–Dc), and GLG1 (Ea–Ec) staining in the striatum of A53T/LRRK2+/− and littermate A53T/LRRK2−/− mice, and A53T/DOX mice at 12 months of age. The caspase3-positive neuron (Aa), activated microglia (Ca) and somatic accumulation of α-syn (Da) were pointed by arrows. The enlarged and α-syn-positive nerve terminals were labeled with arrowhead (Da and Db). The striatum was outlined by TH staining (red, Ba–Bc). Nuclei were labeled by Topro 3 staining (blue). Scale bar: 100 µm (Ba–Bc), 50 µm (Aa–Ac), 20 µm (Ca–Cc), 10 µm (Da–Ec). (F) Bar graph depicts the numbers of neurons remained the dorsal striatum of 12-month old LRRK2+/+, A53T/LRRK2+/+, A53T/LRRK+/−, A53T/LRRK2−/−, and A53T/DOX mice. *p < 0.05, #p < 0.001 (G–H) Western blots show HMW α-syn (G) and Ubi-positive bands (H) in the total homogenates from 12 month-old A53T/LRRK2+/− and A53T/LRRK2−/− mice. (I) Densitometry analyses revealed significant reduction of HMW α-syn in the brain homogenates of 12-month old A53T/LRRK2−/− mice (n=3) compared to age-matched A53T/LRRK+/− mice (n= 4). *p < 0.05 (J) Quantification of trans-Golgi morphology in striatal neurons (≥ 300 per genotype) of mutant and control mice (≥ 3 per genotype) at 12 months of age. ##p < 0.0001

References

    1. Arlotta P, Molyneaux BJ, Jabaudon D, Yoshida Y, Macklis JD. Ctip2 controls the differentiation of medium spiny neurons and the establishment of the cellular architecture of the striatum. J.Neurosci. 2008;28:622–632. - PMC - PubMed
    1. Biskup S, Moore DJ, Celsi F, Higashi S, West AB, Andrabi SA, Kurkinen K, Yu SW, Savitt JM, Waldvogel HJ, Faull RL, Emson PC, Torp R, Ottersen OP, Dawson TM, Dawson VL. Localization of LRRK2 to membranous and vesicular structures in mammalian brain. Ann.Neurol. 2006;60:557–569. - PubMed
    1. Conway KA, Harper JD, Lansbury PT. Accelerated in vitro fibril formation by a mutant alpha-synuclein linked to early-onset Parkinson disease. Nat.Med. 1998;4:1318–1320. - PubMed
    1. Cooper AA, Gitler AD, Cashikar A, Haynes CM, Hill KJ, Bhullar B, Liu K, Xu K, Strathearn KE, Liu F, Cao S, Caldwell KA, Caldwell GA, Marsischky G, Kolodner RD, Labaer J, Rochet JC, Bonini NM, Lindquist S. Alpha-synuclein blocks ER-Golgi traffic and Rab1 rescues neuron loss in Parkinson's models. Science. 2006;313:324–328. - PMC - PubMed
    1. Cuervo AM, Stefanis L, Fredenburg R, Lansbury PT, Sulzer D. Impaired degradation of mutant alpha-synuclein by chaperone-mediated autophagy. Science. 2004;305:1292–1295. - PubMed

Publication types

MeSH terms

Substances