. 2009 Dec 24;64(6):885-97.
doi: 10.1016/j.neuron.2009.11.007.

The ion channel ASIC2 is required for baroreceptor and autonomic control of the circulation

Affiliations

The ion channel ASIC2 is required for baroreceptor and autonomic control of the circulation

Yongjun Lu et al. Neuron. .

Abstract

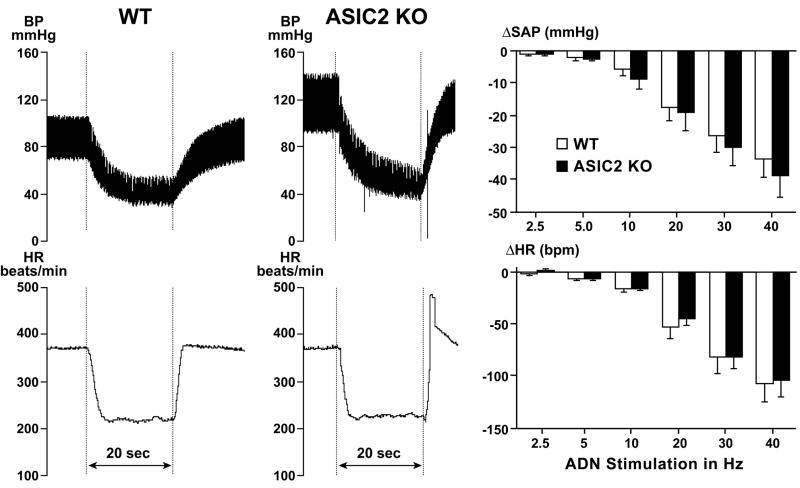
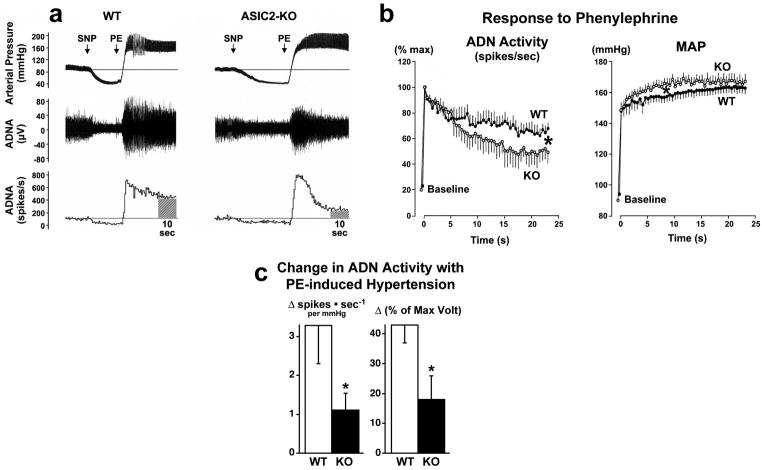
Arterial baroreceptors provide a neural sensory input that reflexly regulates the autonomic drive of circulation. Our goal was to test the hypothesis that a member of the acid-sensing ion channel (ASIC) subfamily of the DEG/ENaC superfamily is an important determinant of the arterial baroreceptor reflex. We found that aortic baroreceptor neurons in the nodose ganglia and their terminals express ASIC2. Conscious ASIC2 null mice developed hypertension, had exaggerated sympathetic and depressed parasympathetic control of the circulation, and a decreased gain of the baroreflex, all indicative of an impaired baroreceptor reflex. Multiple measures of baroreceptor activity each suggest that mechanosensitivity is diminished in ASIC2 null mice. The results define ASIC2 as an important determinant of autonomic circulatory control and of baroreceptor sensitivity. The genetic disruption of ASIC2 recapitulates the pathological dysautonomia seen in heart failure and hypertension and defines a molecular defect that may be relevant to its development.


Figures

Figure 1
Figure 1. Expression of ASICs and their localization in mouse nodose ganglia and aortic baroreceptor terminals
a, Reverse transcription of total RNAs from nodose ganglia. All 5 isomers ASIC1a, 1b, 2a, 2b, and 3 were expressed. b, Relative mRNA expression. Data (mean ± s.e.m.) were obtained by combining 2 ganglia from each of 5 mice. ASIC3 expression was used as the reference. Calculation of copy numbers of target RNA products showed that ASIC2b was more prominently expressed than ASIC1a and 1b and ASIC2a and 3, (P<0.05, unpaired t-test). c, Immunolocalization of ASIC proteins in transfected COS-7 cells. COS-7 cells transfected with ASIC2a and 2b genes in plasmid fluoresced with ASIC2 antibodies (green) whereas the untransfected COS cell (upper left corner) did not. d, Immunohistochemical staining of two nodose ganglia shows ASIC2 antibody fluorescence in the ganglion from an ASIC 2+/+ mouse on the left, but not in the ganglion from the ASIC2 −/− mouse on the right. The lower images show the same ganglia in a differential interference contrast to highlight some unstained neurons in ASIC2 +/+ on the left and the absence of stained neurons in ASIC2 −/− on the right. e, Specific antibodies for ASIC1, ASIC2, and ASIC3 were used. Antibodies of ASIC1 and ASIC3 each co-localize with ASIC2 in 2 different nodose ganglia. f, Double labeling of 2 baroreceptor nerve fibers from mouse aortic arch shows antibodies of neurofilament NF-L and ASIC3 each co-localizing with ASIC2. g, Panels show labeled nerve terminals in the mouse aortic arch with antibodies of ASIC1, ASIC3, and neurofilament NF-L each co-localizing with ASIC2.
Figure 2
Figure 2. Continuous telemetric recordings of arterial blood pressure, heart rate and locomotor activity in conscious mice with ASIC 2 deletion and in WT mice
Continuous measurements of mean arterial pressure, heart rate, and locomotor activity over a 24 hour period are represented here by the means ± s.e.m. of hourly values obtained from 18 ASIC2-KO and 7 WT mice. Mean arterial pressure (MAP) and heart rate (HR) were significantly higher in the null mice despite a significantly lower level of locomotor activity compared to WT mice. The differences between the 2 groups were significant (†P<0.05, by two-way analysis of variance ANOVA). The † signs indicate significant differences at specific time points throughout the diurnal cycle as well as in the average 24-hour measurements represented in the bar graphs for MAP, HR, and locomotor activity (P<0.05 ANOVA, Fisher’s PLSD Post hoc).
Figure 3
Figure 3. Baroreflex and sympatho-vagal balance in conscious mice
The baroreflex during spontaneous fluctuations in arterial pressure and heart rate is impaired in ASIC2 KO (Figures 3a, b and c). a, The arterial pressure tracings (BP mmHg) represent examples of an Up Sequence of 4 beats when arterial pressure was rising (top left tracing) and a Down Sequence of 4 beats when arterial pressure was falling (top right tracing). The steps below the pressure tracings indicate the corresponding pulse intervals (PI ms). The graphs below the tracings represent computer generated plots of the 4 consecutive systolic pressures and their corresponding PIs which in these examples gave an r2 value of ≥ 0.85. Such sequences, which are referred to as baroreflex sequences, were obtained from blood pressure data sampled at 2000Hz for ~1 hour on 2 separate days between 10:00 a.m. and 3:00 p.m. The average number of sequences recorded per 1000 beats during periods of activity, and the average gain or slope of these sequences which reflects baroreflex sensitivity (BRS), were calculated for each animal. The group data are shown in Figures 3b and 3c. b, Baroreflex sensitivity (BRS), expressed as the change in PI (ms) per change in systolic blood pressure (mmHg), was significantly reduced in the ASIC2 null mice (n=14) compared to WT (n=5) (*P<0.05). c, The number of sequences per 1000 beats that reflect the frequency of engagement of the baroreflex during spontaneous fluctuations in arterial pressure in the awake state was significantly lower in the ASIC2-KO mice. The sympatho-vagal balance is disrupted in ASIC2 KO (Figures 3d, e, and f). d, the tachycardic response to atropine is suppressed in the KO mice, reflecting a very low parasympathetic tone compared to WT (HR in beats per min. increased from 513 ± 14 to 653 ± 18 i.e. Δ 140 ± 18 in WT mice, n = 9; vs. an increase from 647 ± 27 to 656 ± 26 i.e. Δ8 ± 2 in KO mice, n = 8). e, the bradycardic response to propranolol (ΔHR in bpm) was greater in ASIC2 KO (from 687 ± 23 to 485 ± 8 i.e. Δ −202 ± 20, n=8) vs. WT mice (from 558 ± 31 to 477 ± 24 i.e. Δ −80 ± 15, n=9) reflecting an increased sympathetic tone in the null mice. f, the resting mean arterial pressure was 120±5 mmHg in WT (n=4) and 128±9 mmHg ASIC2 KO mice (n=5). The fall in mean arterial pressure (MAP) with ganglion blockade with chlorisondamine was greater in the KO vs. WT mice reflecting predominantly a significant increase in the neurogenic sympathetic control of vascular resistance in ASIC2-KO. (*asterisks indicate significant differences between the 2 groups, P<0.05 by unpaired t-test)
Figure 4
Figure 4. Responses to electrical stimulation of the aortic depressor nerve in anesthetized mice
The tracings represent rapid and transient decreases in arterial blood pressure (BP mmHg) and heart rate (HR beats per min.) during a 20 sec. period (horizontal bar) of electrical stimulation with pulses of 2 msec. at 40 Hz and 10 V in a WT mouse (left panels) and an ASIC2 KO mouse (right panels). Bar graphs show the group data (mean ± SE) from WT (open bars, n=7) and ASIC2 KO (black bars, n=9) which indicate that responses to graded frequencies of stimulation from 2.5 to 40 Hz were not statistically different in the 2 groups (ANOVA—group comparison by Student-Newman-Keuls test, P=0.60 and 0.77 for systolic arterial pressure (SAP) and heart rate respectively).
Figure 5
Figure 5. Mechanically-induced depolarization and ASIC2 mRNA expression in aortic vs. non-aortic nodose neurons
a, Schematic of different sensory afferents to nodose ganglia showing injection of the tracer DiI into the aortic arch adventitia to label selectively aortic baroreceptor neurons in the nodose ganglia. b, Dispersed nodose neurons in culture show one fluorescent DiI labeled aortic baroreceptor neuron and several non-labeled ones. c, The mechanical stimulus initiated a rapid depolarization which triggered transient action potential discharge in a DiI labeled mouse neuron. The sharp brief negative deflection at the end of the sustained depolarization represents the response to injection of a transient hyperpolarizing current given to measure changes in membrane conductance. The bar graph shows that labeled aortic baroreceptor neurons from 12 mice depolarized much more (n=35, 7.45±1.03 mV) than non-labeled nodose neurons from 18 mice (n=45, 2.42±0.51 mV) (*P<0.05, unpaired t-test). These depolarizations were from their resting membrane potentials. Membrane conductances measured in DiI positive cells averaged 7.67±0.70 nS before mechanical stimulation and increased during stimulation to 9.06± 0.88 nS (P<0.005, n=19). Corresponding values in non DiI cells were 13.26±1.03 and 13.15±1.07 respectively (P=0.76, n=20). From a holding membrane potential of −60 mV, achieved by current injections, the differences in mechanically-induced depolarizations were greater with corresponding values of 8.72±1.83 mV and 1.57±0.57 mV respectively. d, Single cell RT-PCR of ASIC2a mRNA reveals varying expression levels in 15 individual rat nodose neurons in culture. In different neuron populations studied, ASIC2a was expressed in 55 to 80% of the cells. e, Normalization using housekeeping gene GAPDH revealed that DiI labeled rat aortic baroreceptor neurons had significantly higher ASIC2a mRNA levels compared to non-DiI neurons (*P<0.05, unpaired t-test).
Figure 6
Figure 6. Mechanosensitivity of mouse nodose neurons is significantly reduced in ASIC2 null vs WT and Tg
Responses to 3 sec. mechanical stimulations of nodose neurons from WT (n=24), ASIC2 -KO (n=23) and ASIC2 transgenic (Tg) (n=14) mice. The tracings above each graph are depolarizations of a mechanosensitive neuron selected from each group. The tracing from the Tg neuron is portrayed at different time scales to show the delayed recovery from depolarization. A holding membrane potential was set at −60 mV in all neurons to minimize differences in responses caused by variations in resting membrane potentials. The number of neurons that depolarized less than 1mV or hyperpolarized with mechanical stimulation was significantly greater (chi-test P<0.001) in the null mice (17 of 23) than in the WT (9 of 24). Only one neuron of 14 in the Tg group hyperpolarized. The difference between groups was highly significant by ANOVA (F value of 22.64 vs. Fcrit of 3.15). The neurons from ASIC2 Tg mice had a significantly greater depolarization (11.24±2.20mV) than seen in WT (2.73±0.67 mV) or in ASIC2 null mice (0.86±0.53 mV) (P<0.01 and<0.05 respectively: ANOVA, Post Hoc). Also the response in WT was significantly greater than in KO mice (Wilcoxon Rank Sum, P=0.046; unpaired t-test 2 tail P=0.035; 1 tail P=0.017).
Figure 7
Figure 7. Aortic depressor nerve activity is reduced in ASIC2 null mice
a, The tracings show phasic arterial pressure and aortic depressor nerve activity (ADNA) in a WT and an ASIC2 -KO mouse. ADNA is shown as the magnitude of voltage of action potentials in μV (middle tracings) and as number of spikes generated per second (lower tracings) during changes in arterial pressure with sodium nitroprusside injections (SNP) and phenylephrine injections (PE). Although the peak level of nerve activity during the onset of the pressor response to PE was comparable in both groups, the activity was not maintained in ASIC2 KO and declined rapidly reaching a significantly lower level than in WT. The WT record shows a transient reflex bradycardia apparent following the peak rise in pressure after which both pressure and nerve activity stabilized. Comparisons were made of recordings of both BP and ADNA obtained in the control state before the injection of SNP, and in the steady state during the period between 15 and 25 seconds following the maximum increase in ADNA with injection of PE. b, The left graph represents data points obtained every 500 msec after the maximum increase in spike frequency with PE, and expressed as a % of the peak frequency (% max). The right graph shows the corresponding mean arterial pressure (MAP) over the period of 25 seconds following PE injections. The values are means ± s.e.m. obtained from ASIC2 -KO mice (n=6) and WT mice (n=7). The ADN activity declined rapidly in KO mice to levels that were significantly lower than in WT (*P<0.001 by ANOVA; Newman-Keuls Test). Conversely, MAP rose to statistically higher levels in KO mice initially (*P<0.001 by ANOVA; Newman-Keuls Test) during the first 10 seconds and then plateaued to levels comparable to those in WT. c, The bars represent increases in ADN activity in WT and ASIC2 KO from baseline control values (integrated over a 10-second period prior to SNP injection) to the values obtained during a 10-second period of sustained increase in pressure between 15 and 25 sec. after PE when MAP was not statistically different between the 2 genotypes. The left bars are the increases in spikes · sec−1 for every mmHg increase in pressure from control to the sustained plateau level. The right bars represent the differences in integrated voltage between baseline and plateau levels both expressed as % of max. voltage. The responses in null mice were less than half those seen in WT mice *(P<0.05 unpaired t-test).
Figure 8
Figure 8. Responses to bilateral carotid occlusion before and after section of the ADNs show enhancement of the pressor response with denervation in WT but not in ASIC2 -KO mice
a, Tracings represent increases in phasic (BP) and mean arterial pressure (mean BP) in mmHg during periods of bilateral carotid occlusion for 30 seconds (between the vertical dotted lines) in two anesthetized mice on 100% oxygen. One record was from a WT mouse (top) and the other from an ASIC2 -KO (bottom). Before ADN section (Pre Denervation) the pressor responses were comparable in WT and null mice (left tracings) whereas after ADN section (Post Denervation) the pressor responses were significantly enhanced in the WT but not in the KO (right tracings). b, The bar graphs contrast the mean ± SE of the integrated increase in pressure over time from 0 to 20 sec of carotid occlusion (ΔmmHg·sec) in WT (open bars, n=6) vs. KO mice (black bars, n=6). Pre and Post responses were those obtained before and after section of the ADNs. ADN section caused a significant increase in the pressor response in the WT (*P<0.02) but not in the KO. Following ADN section (Post 0–20sec), the pressor response was significantly less in the ASIC2 null mice than in WT (**P=0.006).

Comment in

Similar articles

Cited by

References

    1. Landgren S. On the excitation mechanism of the carotid baroceptors. Acta Physiol Scand. 1952;26:1–34. - PubMed
    1. Heymans C, Neil E. Reflexogenic Areas of the Cardiovascular System. Boston: Little, Brown & Co; 1958. pp. 1–271.
    1. Mortara A, et al. Arterial baroreflex modulation of heart rate in chronic heart failure. Circulation. 1997;96:3450–3458. - PubMed
    1. La Rovere MT, Bigger JT, Jr, Marcus FI, Mortara A, Schwartz PJ. Baroreflex sensitivity and heart-rate variability in prediction of total cardiac mortality after myocardial infarction. The Lancet. 1998;351:478–484. - PubMed
    1. Robinson TG, Dawson SL, Eames PJ, Panerai RB, Potter JF. Cardiac baroreceptor sensitivity predicts long-term outcome after acute ischemic stroke. Stroke. 2003;34:705–712. - PubMed

Publication types

MeSH terms