

Spatial mapping of thymic stromal microenvironments reveals unique features influencing T lymphoid differentiation
- PMID: 20064453
- PMCID: PMC2807413
- DOI: 10.1016/j.immuni.2009.09.024
Spatial mapping of thymic stromal microenvironments reveals unique features influencing T lymphoid differentiation
Abstract
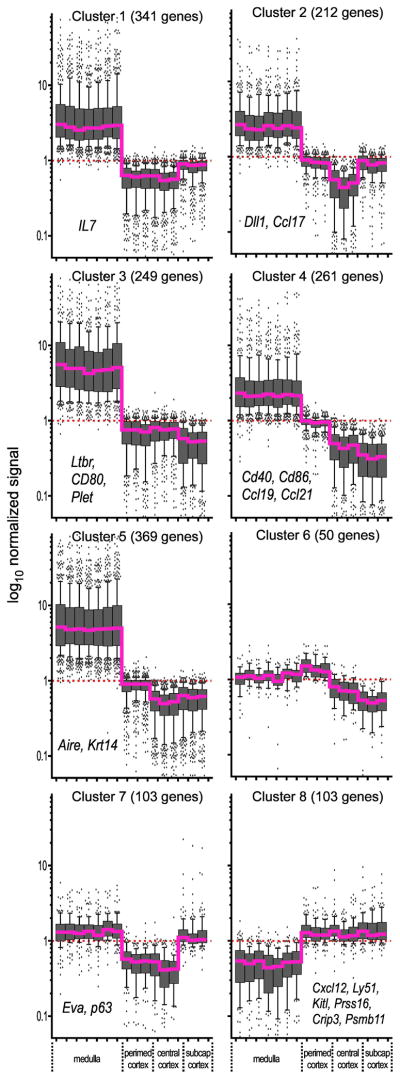
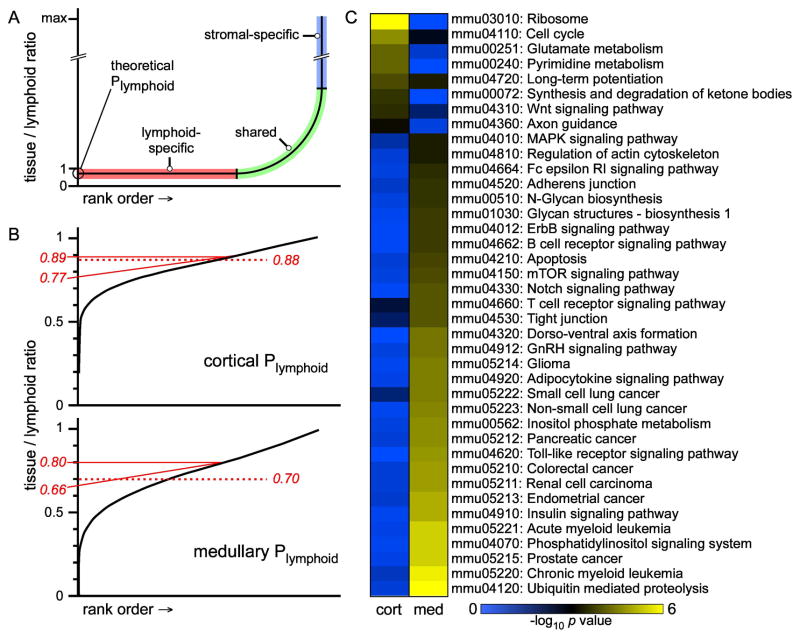
Interaction of hematopoietic progenitors with the thymic microenvironment induces them to proliferate, adopt the T lineage fate, and asymmetrically diverge into multiple functional lineages. Progenitors at various developmental stages are stratified within the thymus, implying that the corresponding microenvironments provide distinct sets of signals to progenitors migrating between them. These differences remain largely undefined. Here we used physical and computational approaches to generate a comprehensive spatial map of stromal gene expression in the thymus. Although most stromal regions were characterized by a unique gene expression signature, the central cortex lacked distinctive features. Instead, a key function of this region appears to be the sequestration of unique microenvironments found at the cortical extremities, thus modulating the relative proximity of progenitors moving between them. Our findings compel reexamination of how cell migration, lineage specification, and proliferation are controlled by thymic architecture and provide an in-depth resource for global characterization of this control.
Copyright 2009 Elsevier Inc. All rights reserved.
Figures
Similar articles
-
Zoned out: functional mapping of stromal signaling microenvironments in the thymus.Annu Rev Immunol. 2007;25:649-79. doi: 10.1146/annurev.immunol.23.021704.115715. Annu Rev Immunol. 2007. PMID: 17291187 Review.
-
Critical role for CXCR4 signaling in progenitor localization and T cell differentiation in the postnatal thymus.J Immunol. 2003 Nov 1;171(9):4521-7. doi: 10.4049/jimmunol.171.9.4521. J Immunol. 2003. PMID: 14568925
-
Serial progression of cortical and medullary thymic epithelial microenvironments.Eur J Immunol. 2014 Jan;44(1):16-22. doi: 10.1002/eji.201344110. Epub 2013 Dec 4. Eur J Immunol. 2014. PMID: 24214487 Free PMC article. Review.
-
Stromal cells provide the matrix for migration of early lymphoid progenitors through the thymic cortex.J Immunol. 2002 Oct 15;169(8):4354-61. doi: 10.4049/jimmunol.169.8.4354. J Immunol. 2002. PMID: 12370368
-
Thymic anlage is colonized by progenitors restricted to T, NK, and dendritic cell lineages.J Immunol. 2005 Mar 1;174(5):2525-32. doi: 10.4049/jimmunol.174.5.2525. J Immunol. 2005. PMID: 15728458
Cited by
-
T-cell selection in the thymus: a spatial and temporal perspective.Immunol Rev. 2016 May;271(1):114-26. doi: 10.1111/imr.12398. Immunol Rev. 2016. PMID: 27088910 Free PMC article. Review.
-
Global transcriptional profiling reveals distinct functions of thymic stromal subsets and age-related changes during thymic involution.Cell Rep. 2014 Oct 9;9(1):402-415. doi: 10.1016/j.celrep.2014.08.070. Epub 2014 Oct 2. Cell Rep. 2014. PMID: 25284794 Free PMC article.
-
Functional development of the T cell receptor for antigen.Prog Mol Biol Transl Sci. 2010;92:65-100. doi: 10.1016/S1877-1173(10)92004-8. Prog Mol Biol Transl Sci. 2010. PMID: 20800817 Free PMC article.
-
Laminin-Mediated Interactions in Thymocyte Migration and Development.Front Immunol. 2015 Nov 17;6:579. doi: 10.3389/fimmu.2015.00579. eCollection 2015. Front Immunol. 2015. PMID: 26635793 Free PMC article. Review.
-
Opposing chemokine gradients control human thymocyte migration in situ.J Clin Invest. 2013 May;123(5):2131-42. doi: 10.1172/JCI67175. Epub 2013 Apr 15. J Clin Invest. 2013. PMID: 23585474 Free PMC article.
References
-
- Anderson MS, Venanzi ES, Klein L, Chen Z, Berzins SP, Turley SJ, von Boehmer H, Bronson R, Dierich A, Benoist C, Mathis D. Projection of an immunological self shadow within the thymus by the aire protein. Science. 2002;298:1395–1401. - PubMed
-
- Beck S, Le Good JA, Guzman M, Ben Haim N, Roy K, Beermann F, Constam DB. Extraembryonic proteases regulate Nodal signalling during gastrulation. Nat Cell Biol. 2002;4:981–985. - PubMed
-
- Bevan MJ. In a radiation chimaera, host H-2 antigens determine immune responsiveness of donor cytotoxic cells. Nature. 1977;269:417–418. - PubMed
-
- Boursalian TE, Golob J, Soper DM, Cooper CJ, Fink PJ. Continued maturation of thymic emigrants in the periphery. Nat Immunol. 2004;5:418–425. - PubMed
Publication types
MeSH terms
Associated data
- Actions
Grants and funding
LinkOut - more resources
Full Text Sources
Other Literature Sources
Molecular Biology Databases
