. 2009 Dec 25;36(6):984-95.
doi: 10.1016/j.molcel.2009.11.005.

Controlling hematopoiesis through sumoylation-dependent regulation of a GATA factor

Affiliations

Controlling hematopoiesis through sumoylation-dependent regulation of a GATA factor

Hsiang-Ying Lee et al. Mol Cell. .

Abstract

GATA factors establish transcriptional networks that control fundamental developmental processes. Whereas the regulator of hematopoiesis GATA-1 is subject to multiple posttranslational modifications, how these modifications influence GATA-1 function at endogenous loci is unknown. We demonstrate that sumoylation of GATA-1 K137 promotes transcriptional activation only at target genes requiring the coregulator Friend of GATA-1 (FOG-1). A mutation of GATA-1 V205G that disrupts FOG-1 binding and K137 mutations yielded similar phenotypes, although sumoylation was FOG-1 independent, and FOG-1 binding did not require sumoylation. Both mutations dysregulated GATA-1 chromatin occupancy at select sites, FOG-1-dependent gene expression, and were rescued by tethering SUMO-1. While FOG-1- and SUMO-1-dependent genes migrated away from the nuclear periphery upon erythroid maturation, FOG-1- and SUMO-1-independent genes persisted at the periphery. These results illustrate a mechanism that controls trans-acting factor function in a locus-specific manner, and differentially regulated members of the target gene ensemble reside in distinct subnuclear compartments.


Figures

Figure 1
Figure 1. GATA-1 K137 is Differentially Required for Endogenous Target Gene Regulation
(A) Schematic representation of proteins expressed and analyzed in G1E cells. The arrow indicates the K137 residue, which is mutated to either alanine or arginine in mutant proteins. (B) Western blot analysis showing the protein expression levels of wild-type and mutant ER-GATA-1 in clonal cell lines. The asterisk indicates sumoylated GATA-1. (C) Wright-Giemsa staining of uninduced and β-estradiol-induced (48 h) G1E-ER-GATA-1 clones 9 and 12 as well as G1E-ER-GATA-1(K137R) clone 71. (D) Quantitation of GATA-1 target gene expression. Real-time RT-PCR analysis of target gene expression in untreated and β-estradiol-treated (24 h) G1E clonal cell lines stably expressing ER-GATA-1, ER-GATA-1(K137R), or ER-GATA-1(K137A). Each circle represents the average of 4 independent experiments for one clonal line. Grey bars, fold activation or repression (mean +/− S.E.) of all clonal lines analyzed. Red asterisk, p < 0.05 (ER-GATA-1 vs. K137 mutants).
Figure 2
Figure 2. Sumoylation Underlies the Critical Function of GATA-1 K137
(A) Immunoprecipitation analysis of ER-GATA-1 sumoylation in β-estradiol-treated (24 h) G1E-ER-GATA-1 cells. Asterisk, sumoylated GATA-1. (B) Western blot analysis of ER-GATA-1 sumoylation in FOG-1-null cells stably expressing ER-GATA-1. Asterisk, sumoylated GATA-1. (C) (Top) Schematic representation of the SUMO-1 fusion with ER-GATA-1(K137R). (Bottom) Western blot analysis showing the protein expression level of clonal cell lines analyzed. (D) Real-time RT-PCR analysis of target gene expression in untreated and β-estradiol-treated (24 h) G1E cells stably expressing ER-GATA-1(K137R) or ER-GATA-1(SUMO-1/K137R). Each circle represents mean values from one clonal line analyzed in 3 independent experiments. Grey bars, fold activation (mean +/− S.E.) of all clonal lines analyzed. Red asterisk, p < 0.05. (E) Western blot analysis of ER-GATA-1, ER-GATA-1(K137R), and ER-GATA-1(SUMO-1/KR) expression after Nucleofector II-mediated transfection of G1E cells and treatment with β-estradiol as described in Experimental Procedures. (F) Real-time RT-PCR analysis of endogenous GATA-1 target genes after transient complementation analysis in G1E cells. (mean +/− S.E.; 3 independent experiments). (G) (Top) Western blot analysis of ER-GATA-1 and ER-GATA-1(E139A) expression after transient complementation analysis in G1E cells. (Bottom) Real-time RT-PCR analysis of endogenous GATA-1 target genes. (mean +/− S.E.; 3 independent experiments). (H) Western blot analysis of β-estradiol-treated (24 h) G1E-ER-GATA-1 cells showing the ER-GATA-1 and ER-GATA-1(K137R) protein levels in whole cell samples and isolated nuclei. (I) Immunofluoresence analysis of ER-GATA-1, ER-GATA-1(K137R), and ER-GATA-1(SUMO-1/KR) after transient complementation analysis in G1E cells and treatment with β-estradiol. The percentages of cells exhibiting specific staining patterns, based on scoring 200 transfected cells, are indicated in parentheses.
Figure 3
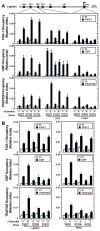
Figure 3. K137 Facilitates GATA-1 Chromatin Occupancy at Select Sites and Pol II Recruitment
(A, B) Quantitative ChIP analysis of ER-GATA-1, ER-GATA-1(K137R), and ER-GATA-1(K137A) occupancy in untreated and β-estradiol-treated G1E cells stably expressing ER-GATA-1, ER-GATA-1(K137R), or ER-GATA-1(K137A). The chromatin sites analyzed are indicated on the locus diagrams at the top of the graphs. (mean +/− S.E., 2 distinct clonal lines, each analyzed in 3 independent experiments). (C) Quantitative ChIP analysis of Pol II occupancy at the promoters of the βmajor, α-globin, Ahsp and RPII215 loci in untreated and β-estradiol-treated (24 h) G1E cells stably expressing ER-GATA-1, ER-GATA-1(K137R), or ER-GATA-1(K137A) (mean +/− S.E., 2 distinct clonal lines, each analyzed in 3 independent experiments) (ERG1, ER-GATA-1; PI, preimmune sera)
Figure 4
Figure 4. GATA-1 K137 Requirement for Coregulator Recruitment at Select Chromatin Sites
(A) Quantitative ChIP analysis of FOG-1, CBP, and TRAP220 occupancy at the β-globin locus in untreated and β-estradiol-treated (24 h) G1E cells stably expressing ER-GATA-1, ER-GATA-1(K137R), or ER-GATA-1(K137A). The organization of β-globin locus is shown on the top. (B) Quantitative ChIP analysis of coregulator occupancy at α-globin and Ahsp promoters. The identical cells described in A were analyzed (mean +/− S.E., 2 distinct clonal lines each analyzed in 3 independent experiments). (ERG1, ER-GATA-1; PI, preimmune sera).
Figure 5
Figure 5. SUMO-1 Rescues the Defective Activity of ER-GATA-1(V205G) but not that of ER-GATA-1(C261P)
(A) Models illustrating V205-dependent and V205-independent mechanisms by which sumoylation might regulate GATA-1 activity. (B) Schematic representation of proteins analyzed. (C) Western blot analysis of ER-GATA-1, ER-GATA-1(V205G), and ER-GATA-1(SUMO-1/V205G) expression after transient complementation analysis in G1E cells. (D) Real-time RT-PCR analysis of GATA-1 target gene expression (mean +/− S.E.; 3 independent experiments). (E) Western blot analysis of ER-GATA-1, ER-GATA-1(C261P), and ER-GATA-1(SUMO-1/C261P) expression after transient complementation analysis in G1E cells. (F) Real-time RT-PCR analysis of GATA-1 target gene expression. (mean +/− S.E.; 3 independent experiments).
Figure 6
Figure 6. Molecular Mechanisms Underlying Sumoylation-Dependent Control of GATA-1 Activity
(A) Confocal microscopy analysis of subcellular localization upon transient complementation of G1E cells treated with β-estradiol. The percentages of cells exhibiting specific staining patterns, based on scoring 150 transfected cells, are indicated in parentheses. (B) Co-immunoprecipitation analysis of endogenous FOG-1 binding. ER-GATA-1, ER-GATA-1(V205G), or ER-GATA-1(SUMO-1/V205G) were expressed by transient complementation analysis in G1E cells treated with β-estradiol. (C) Western blot analysis showing the protein expression level of clonal cell lines analyzed. Asterisk, sumoylated ER-GATA-1, ER-GATA-1(V205G) or ER-GATA-1(SUMO-1/V205G). (D) Real-time RT-PCR analysis of gene expression in untreated and β-estradiol-treated (24 h) G1E cells stably expressing ER-GATA-1, ER-GATA-1(V205G) or ER-GATA-1(SUMO-1/V205G). Circles represent mean values from one clonal line analyzed in 3 independent experiments. Grey bars, fold activation (mean +/− S.E.) of all clonal lines analyzed. (E) Quantitative ChIP analysis of ER-GATA-1, FOG-1, and Pol II occupancy at endogenous sites in β-estradiol-treated (24 h) G1E cells stably expressing ER-GATA-1, ER-GATA-1(V205G), or ER-GATA-1(SUMO-1/V205G). (mean +/− S.E., 2 independent experiments, each analyzed in duplicate). Red asterisk, p < 0.05. (F) Models depicting sumoylation- and FOG-1-dependent control of GATA-1 activity. K137 sumoylation and FOG-1 binding facilitate chromatin occupancy. FOG-1 is not essential for K137 sumoylation. Sumoylation is not required for GATA-1 binding to FOG-1, but increases FOG-1 association with GATA-1-occupied chromatin sites.
Figure 7
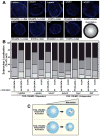
Figure 7. Target Gene Ensemble Members with Distinct Coregulator and Posttranslational Modification Requirements Reside in Different Subnuclear Compartments
(A) Semi-quantitative 3D immuno-FISH analysis of β-estradiol-treated (24 h) G1E cells stably expressing ER-GATA-1 or ER-GATA-1(K137R). Blue, nuclear lamin immunofluorescence. Red, probes detecting the loci indicated. (Bottom right) Cells were divided into 5 concentric shells, each encompassing 20% of the radius. Shell 1 represents the nuclear periphery, whereas shell 5 represents the center of the nucleus. (B) Distribution of FOG-1/SUMO-1-dependent or –independent loci in untreated and β-estradiol-treated (24 h) G1E cells stably expressing ER-GATA-1 or ER-GATA-1(K137R). (~100 loci were scored per gene) (C) Model illustrating the subnuclear localization of FOG-1/SUMO-1-dependent or -independent genes during erythroid maturation.

Similar articles

Cited by

References

    1. Anguita E, Hughes J, Heyworth C, Blobel GA, Wood WG, Higgs DR. Globin gene activation during hematopoiesis is driven by protein complexes nucleated by GATA-1 and GATA-2. EMBO J. 2004;23:2841–2852. - PMC - PubMed
    1. Anguita E, Sharpe JA, Sloane-Stanley JA, Tufarelli C, Higgs DR, Wood WG. Deletion of the mouse alpha-globin regulatory element (HS-26) has an unexpectedly mild phenotype. Blood. 2002;100:3450–3456. - PubMed
    1. Blobel GA, Nakajima T, Eckner R, Montminy M, Orkin SH. CREB-binding protein cooperates with transcription factor GATA-1 and is required for erythroid differentiation. Proc Natl Acad Sci USA. 1998;95:2061–2066. - PMC - PubMed
    1. Bresnick EH, Johnson KD, Kim SI, Im H. Establishment and regulation of chromatin domains: mechanistic insights from studies of hemoglobin synthesis. Prog Nucl Acids Res Mol Biol. 2006;81:435–471. - PubMed
    1. Bulger M, Schubeler D, Bender MA, Hamilton J, Farrell CM, Hardison RC, Groudine M. A complex chromatin landscape revealed by patterns of nuclease sensitivity and histone modification within the mouse beta-globin locus. Mol Cell Biol. 2003;23:5234–5244. - PMC - PubMed

Publication types

MeSH terms

LinkOut - more resources