. 2010 Apr 15;316(7):1213-24.
doi: 10.1016/j.yexcr.2010.01.005. Epub 2010 Jan 11.

Modulation of mitochondrial function and morphology by interaction of Omi/HtrA2 with the mitochondrial fusion factor OPA1

Affiliations

Modulation of mitochondrial function and morphology by interaction of Omi/HtrA2 with the mitochondrial fusion factor OPA1

Nicole Kieper et al. Exp Cell Res. .

Abstract

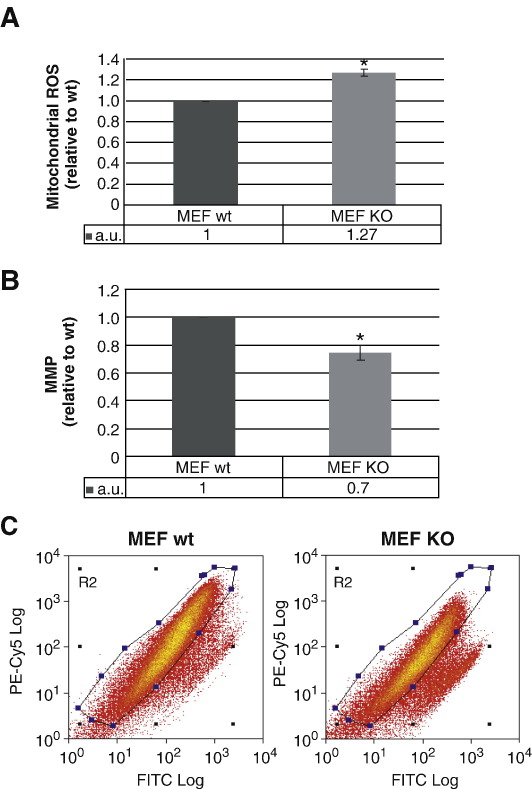
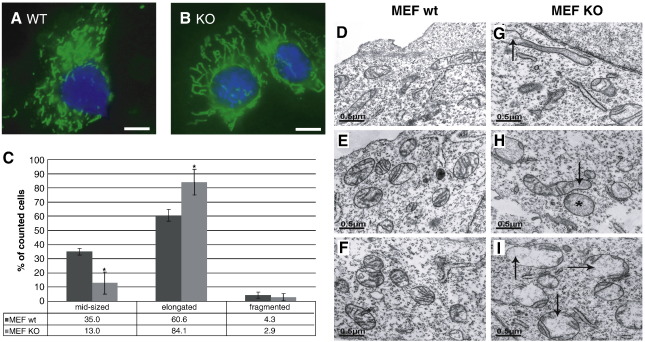
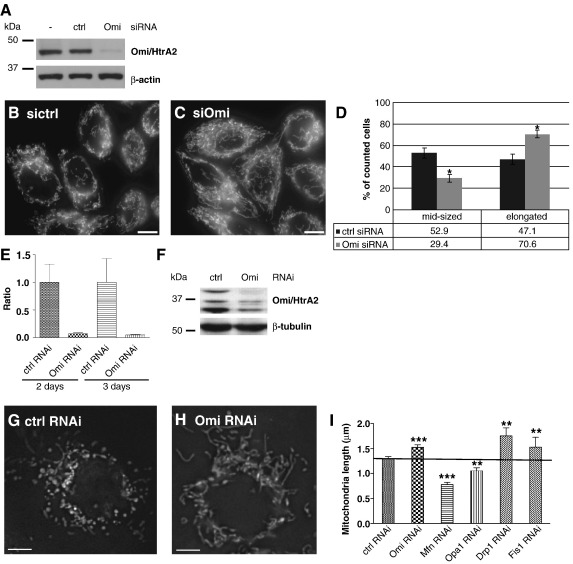
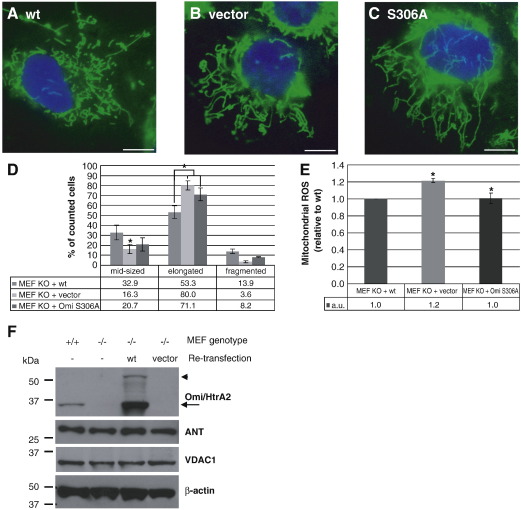
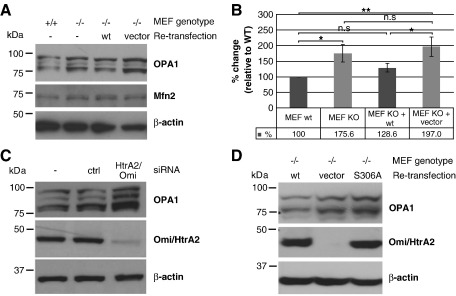
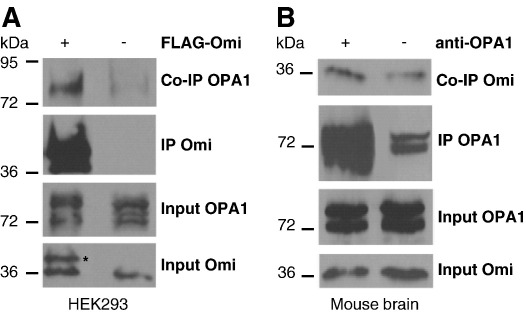
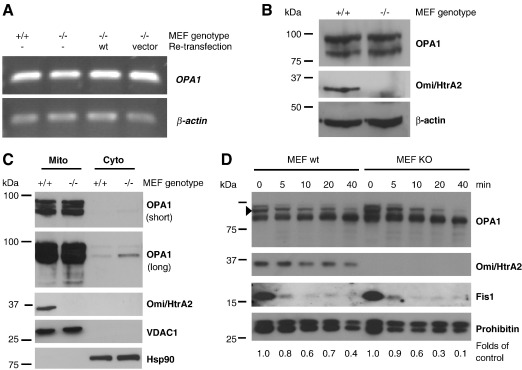
Loss of Omi/HtrA2 function leads to nerve cell loss in mouse models and has been linked to neurodegeneration in Parkinson's and Huntington's disease. Omi/HtrA2 is a serine protease released as a pro-apoptotic factor from the mitochondrial intermembrane space into the cytosol. Under physiological conditions, Omi/HtrA2 is thought to be involved in protection against cellular stress, but the cytological and molecular mechanisms are not clear. Omi/HtrA2 deficiency caused an accumulation of reactive oxygen species and reduced mitochondrial membrane potential. In Omi/HtrA2 knockout mouse embryonic fibroblasts, as well as in Omi/HtrA2 silenced human HeLa cells and Drosophila S2R+ cells, we found elongated mitochondria by live cell imaging. Electron microscopy confirmed the mitochondrial morphology alterations and showed abnormal cristae structure. Examining the levels of proteins involved in mitochondrial fusion, we found a selective up-regulation of more soluble OPA1 protein. Complementation of knockout cells with wild-type Omi/HtrA2 but not with the protease mutant [S306A]Omi/HtrA2 reversed the mitochondrial elongation phenotype and OPA1 alterations. Finally, co-immunoprecipitation showed direct interaction of Omi/HtrA2 with endogenous OPA1. Thus, we show for the first time a direct effect of loss of Omi/HtrA2 on mitochondrial morphology and demonstrate a novel role of this mitochondrial serine protease in the modulation of OPA1. Our results underscore a critical role of impaired mitochondrial dynamics in neurodegenerative disorders.


Figures

Fig. 1
Fig. 1
Analysis of ROS levels and mitochondrial membrane potential in Omi/HtrA2 WT and KO MEF cells. (A) Mitochondrial ROS levels were analyzed by staining with the fluorescent dye MitoSOX. (⁎p < 0.006). (B, C) MMP was determined by a double staining with MitoTracker GreenFM and MitoTracker CM-H2XRos. (B) The ratio of MitoTracker GreenFM to Mitotracker CM-H2XRos staining was measured as a readout for the MMP (⁎p <   0.003). Error bars show the standard deviation (SD). (C) Scattergraph representative of an Omi/HtrA2 WT (left graph) and KO (right graph) MEF MMP measurement. The selected area in blue represents the measured cells with intact MMP. The loss of signal in the marked area indicates a decrease in MMP. All results are given as relative comparisons to WT. The results represent the mean of three independent experiments.
Fig. 2
Fig. 2
Effects of Omi/HtrA2 on mitochondrial morphology in MEF cells. (A, B) Live Omi/HtrA2 WT (A) and KO (B) MEF cells were concomitantly stained with MitoTracker GreenFM and Hoechst 33342 for 10 min. Size bar corresponds to 10 μm. (C) Mitochondrial morphology was classified into 3 categories: elongated, middle sized and fragmented. The results are shown as the percentage of WT (dark bars) and KO (light bars) cells with mitochondria falling into these categories as scored by an observer blinded to the MEF cell genotype (⁎p <   0.05). Error bars show the SD. (D–I) Electron microscopy shows that mitochondria in MEF KO cells (G–I) differed from control MEF WT cells (D–F) by failure to form elaborated cristae structures. Examples of mitochondria with a local loss of cristae structures (arrow in H and I) or a complete loss of folded inner membrane structures (asterisk in H and arrow in G).
Fig. 3
Fig. 3
Mitochondrial morphology in Omi/HtrA2 silenced HeLa and S2R+ cells. (A) Treatment of HeLa cells with Omi/HtrA2 siRNA greatly reduced the levels of Omi/HtrA2 protein compared to non-transfected (−) and control siRNA treated cells (ctrl). Re-probing the Western blot for β-actin confirmed equal loading. (B–D) The mitochondrial morphology was investigated in HeLa cells transfected with control siRNA (B) or Omi/HtrA2 siRNA (C). The mitochondria were scored in each cell as either elongated or normal and quantified (D). Error bars show the SD; ⁎p <   0.005. Scale bar corresponds to 10 μm. (E) Quantitative real-time PCR measurement of Omi/HtrA2 knock down in S2R+ cells compared to control. (F) Western blot of Omi/HtrA2 levels in S2R+ control and Omi/HtrA2 dsRNA treated cells. β-Tubulin was used as a loading control. (G–I) S2R+ cells treated with control (ctrl) (G) or Omi/HtrA2 (H) dsRNAs stained with mitochondrial dye rhodamine123 dye. Scale bars correspond to 5 μm. (I) Mitochondrial length was quantified and compared to knock down of known fission and fusion factors (Mfn/Marf, OPA1, Drp1, Fis1) (⁎⁎ p < 0.01, ⁎⁎⁎ p < 0.001). Error bars show the standard error of the mean (SEM).
Fig. 4
Fig. 4
Re-transfection of KO MEFs with human WT Omi/HtrA2 rescues the phenotype. (A–D) The mitochondrial morphology of Omi/HtrA2 KO MEF cells stably overexpressing either human WT Omi/HtrA2 (A), empty vector (B) or a synthetic protease dead mutant of Omi/HtrA2 (C) was investigated using the same procedure as in Fig. 2. Scale bar corresponds to 10 μm. In the quantification (D), error bars indicate the SEM (⁎p <   0.05). (E) Stably re-transfected MEF cells were stained with the fluorescent dye MitoSOX to investigate the levels of intramitochondrial ROS. The procedure was the same as was used for the WT and KO cells. The result is the mean of three independent experiments and a relative comparison of Omi/HtrA2 KO re-transfected with vector compared to those re-transfected with WT or S306A Omi/HtrA2, where WT was set to 1 (⁎p <   0.06). Error bars indicate the SD. (F) WT and KO MEF cells as well as KO MEFs retransfected with either WT Omi/HtrA2 or empty vector were lysed with 1% Triton X-100 in TNE. The stable overexpression of human Omi/HtrA2 leads to expression of an ≈ 50 kDa precursor (arrow head) that is efficiently processed to the ≈ 35 kDa mature form (arrow) co-migrating with the endogenous Omi/HtrA2, which is completely absent in KO MEF cells and vector controls when analyzed by Western blot. To investigate whether there is a change in the mitochondrial membrane mass, the relative amounts of the outer membrane protein VDAC1 and inner membrane protein ANT were also probed. β-Actin was used as a loading control.
Fig. 5
Fig. 5
Effects of Omi/HtrA2 on OPA1 protein levels in mouse and human cell lines. (A, B) Omi/HtrA2 WT and KO MEF cells, as well as with WT Omi/HtrA2 and vector stably re-transfected KO cells, were lysed with 1% Triton X-100 in buffer and subjected to immunoblotting. (A) Western blots were probed for the mitochondrial fusion protein OPA1 and Mfn2. β-Actin was used as a loading control. (B) Densitometric analysis of OPA1 band intensities, after 1% Triton X-100 in TNE extraction, in three independent experiments is depicted here (n.s. = not significant, ⁎p <   0.05, ⁎⁎p <   0.01). Error bars indicate the SD. (C) Effects of Omi/HtrA2 on OPA1 levels were reproduced in HeLa cells. The silencing efficiency as well as the corresponding changes in OPA1 levels was detected in untreated, control or Omi/HtrA2 silenced HeLa cells lysed with 1% Triton X-100 in buffer and subjected to Western blot analysis using antibodies against OPA1, Omi/HtrA2 and β-actin as a loading control. (D) Omi/HtrA2 KO and WT MEF cells were stably re-transfected with either control vector, WT or protease mutant [S306A]Omi/HtrA2, and the cells were lysed with 1% Triton X-100 buffer and subjected to Western blot analysis using antibodies against OPA1 , Omi/HtrA2 and β-actin as a loading control.
Fig. 6
Fig. 6
Omi/HtrA2 physically interacts with OPA1. (A) HEK293 cells were stably transfected with FLAG-tagged Omi/HtrA2 (+) while untransfected cells (−) were used as controls. Lysates were subjected to Western blot analysis directly (inputs) or after incubation overnight with anti-FLAG coupled agarose. Immunoblots were probed with anti-OPA1 and anti-Omi/HtrA2 as indicated. The asterisk marks the recombinant form of Omi/HtrA2. The input sample was taken before adding the agarose. (B) Co-immunoprecipitation of endogenous Omi/HtrA2 and OPA1 in lysates from C57/Bl6 mouse brain. Lysates were subjected to Western blot analysis directly (inputs) or after incubation overnight with either protein G agarose alone (−) or with anti-OPA1 bound to protein G agarose (+). Immunoblots were probed with anti-OPA1 and anti-Omi/HtrA2 as indicated.
Fig. 7
Fig. 7
Differences in OPA1 levels are due to protein accessibility. (A) Semiquantitative RT-PCR was performed on mRNA isolated from Omi/HtrA2 WT or KO and re-transfected MEF cells. There are no differences in the OPA1 mRNA levels (upper panel). Amplification of β-actin served as loading control (lower panel). (B) For analysis of the full cell content, 150,000 control and Omi/HtrA2 KO MEF cells were harvested, lysed directly in Laemmli SDS-PAGE sample buffer and analyzed by Western blot. Immunoblots were probed with anti-OPA1 (short and long exposure) and anti-Omi/HtrA2 and β-actin was used as a loading control. (C) Mitochondrial and cytosolic fractions prepared from Omi/HtrA2 WT and KO cells were subjected to Western blotting and analyzed for localization of both OPA1 and Omi/HtrA2. The purity of the cytosolic (Cyto) and mitochondrial (Mito) fractions was assessed by probing for Hsp90 and VDAC1, respectively. (D) Mitochondria isolated from control (left lanes) or Omi/HtrA2 KO (right lanes) MEF cells were subjected to proteinase K digestion for indicated time points. Western blots were prepared and probed with anti-OPA1 and anti-Omi/HtrA2 as indicated. The outer membrane associated protein Fis1 was rapidly degraded whereas the inner membrane protein prohibitin was shielded. The higher molecular weight OPA1 band densitometrically analyzed (arrow head) is indicated and the fold change compared to untreated (time point 0) is shown below the Western blot (D).

References

    1. Vande Walle L., Lamkanfi M., Vandenabeele P. The mitochondrial serine protease HtrA2/Omi: an overview. Cell Death Differ. 2008;15:453–460. - PubMed
    1. Hegde R., Srinivasula S.M., Zhang Z., Wassell R., Mukattash R., Cilenti L., DuBois G., Lazebnik Y., Zervos A.S., Fernandes-Alnemri T., Alnemri E.S. Identification of Omi/HtrA2 as a mitochondrial apoptotic serine protease that disrupts inhibitor of apoptosis protein-caspase interaction. J. Biol Chem. 2002;277:432–438. - PubMed
    1. Martins L.M., Iaccarino I., Tenev T., Gschmeissner S., Totty N.F., Lemoine N.R., Savopoulos J., Gray C.W., Creasy C.L., Dingwall C., Downward J. The serine protease Omi/HtrA2 regulates apoptosis by binding XIAP through a reaper-like motif. J. Biol Chem. 2002;277:439–444. - PubMed
    1. Verhagen A.M., Silke J., Ekert P.G., Pakusch M., Kaufmann H., Connolly L.M., Day C.L., Tikoo A., Burke R., Wrobel C., Moritz R.L., Simpson R.J., Vaux D.L. HtrA2 promotes cell death through its serine protease activity and its ability to antagonize inhibitor of apoptosis proteins. J. Biol Chem. 2002;277:445–454. - PubMed
    1. Inagaki R., Tagawa K., Qi M.L., Enokido Y., Ito H., Tamura T., Shimizu S., Oyanagi K., Arai N., Kanazawa I., Wanker E.E., Okazawa H. Omi/HtrA2 is relevant to the selective vulnerability of striatal neurons in Huntington's disease. Eur. J. Neurosci. 2008;28:30–40. - PubMed

Publication types

MeSH terms