. 2010 Apr;38(7):2314-31.
doi: 10.1093/nar/gkp1192. Epub 2010 Jan 11.

Increased origin activity in transformed versus normal cells: identification of novel protein players involved in DNA replication and cellular transformation

Affiliations

Increased origin activity in transformed versus normal cells: identification of novel protein players involved in DNA replication and cellular transformation

Domenic Di Paola et al. Nucleic Acids Res. 2010 Apr.

Abstract

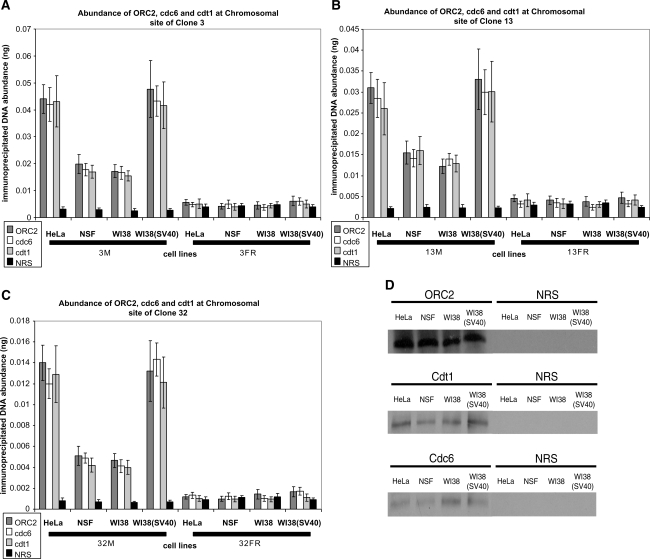
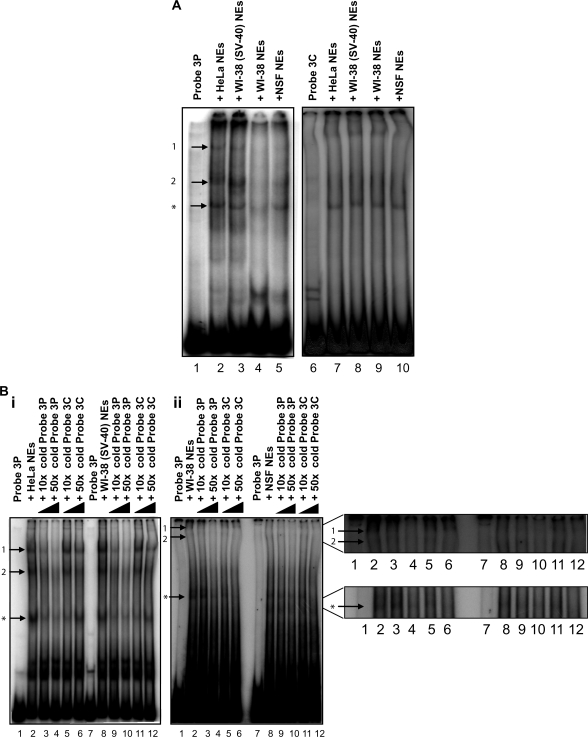
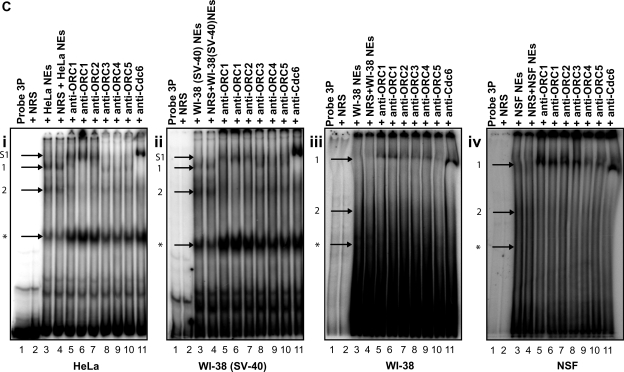
Using libraries of replication origins generated previously, we identified three clones that supported the autonomous replication of their respective plasmids in transformed, but not in normal cells. Assessment of their in vivo replication activity by in situ chromosomal DNA replication assays revealed that the chromosomal loci corresponding to these clones coincided with chromosomal replication origins in all cell lines, which were more active by 2-3-fold in the transformed by comparison to the normal cells. Evaluation of pre-replication complex (pre-RC) protein abundance at these origins in transformed and normal cells by chromatin immunoprecipitation assays, using anti-ORC2, -cdc6 and -cdt1 antibodies, showed that they were bound by these pre-RC proteins in all cell lines, but a 2-3-fold higher abundance was observed in the transformed by comparison to the normal cells. Electrophoretic mobility shift assays (EMSAs) performed on the most efficiently replicating clone, using nuclear extracts from the transformed and normal cells, revealed the presence of a DNA replication complex in transformed cells, which was barely detectable in normal cells. Subsequent supershift EMSAs suggested the presence of transformation-specific complexes. Mass spectrometric analysis of these complexes revealed potential new protein players involved in DNA replication that appear to correlate with cellular transformation.


Figures

Figure 1.
Figure 1.
Episomal replication activity of clones 3, 13 and 32 in HeLa and NSF cells. Histogram plot of the number of bacterial colonies produced after transformation of E. coli with DpnI-digested Hirt extracts of HeLa and NSF cells transfected for 72 h with one of the following constructs: pA3/4, pLB2, pLB2C1, pCLONE 3, pCLONE 13 and pCLONE 32. The average number of DpnI-resistant colonies per plate was corrected for the amount of DNA recovered and normalized to the number of colonies obtained with pA3/4 (most efficiently replicating clone), which was taken as 100%. The number at the bottom of each bar denotes the average number of colonies obtained from three experiments. The error bars represent the average of three experiments performed in triplicate and 1 SD.
Figure 2.
Figure 2.
Copy number per haploid genome of clones 3, 13 and 32 at their respective chromosomal loci in normal and transformed cell lines (A–C) and nascent DNA preparation (D, E). (Top section of A–C) PCR amplification products (362 bp, 425 bp, 270 bp) produced by primer sets 3 M, 13 M and 32 M, respectively, resolved on a 2% agarose gel and stained by ethidium bromide. Template DNA was as follows: lanes 1–3, genomic DNA (1, 2, 3 ng, respectively) from NSF cells [used to build the standard curve for quantification of DNA by real-time PCR; positive control (+ve)]; lanes 4–7, 10 ng of genomic DNA from: HeLa, NSF, WI38, WI38(SV40) cells; lane 8, water [no template DNA added; negative control (−ve)]. (Bottom section of A–C) Histogram plot of copy number/haploid genome of clones 3, 13 and 32 in all cell lines used in the study. The results were normalized by making NSF equal to one copy/haploid genome for primer sets 3 and 32 (or equal to two copies/haploid genome for primer set 13). The error bars represent the average of at least two experiments performed in triplicate and 1 SD. (NB: these are representative graphs, as the copy number of all the primer sets used in this study was measured; Supplementary Table S2.) (D) Nascent DNA preparation. Lane 1: GeneRuler DNA Ladder Mix; lane 2: ∼600 ng total cellular (DNA + RNA) sheared with a fine needle (26G3/8); lane 3: ∼1200 ng sheared and denatured total cellular (DNA + RNA); the single band was the internal control, linear pCR-XL-TOPO (∼50 ng); lane 4: sheared total cellular (DNA + RNA) and internal linear control digested by λ-exonuclease; lane 5: the nascent DNA sample after further treatment with RNase A; lane 6: HindIII-digested λ phage DNA marker. The nucleic acids were separated by electrophoresis on a 1% agarose native gel. (E) Assessment of quality of nascent DNA, exemplified by the lamin B2 origin, in HeLa, NSF, WI38 and WI38(SV40) cells. Histogram plot of the nascent DNA abundance (ng), measured by real-time PCR, at the lamin B2 peak region (dark gray) and a non-origin-containing (control) region, located ∼4 kb downstream (light gray). The error bars represent the average of at least two experiments performed in triplicate and 1 SD.
Figure 3.
Figure 3.
Nascent DNA abundance of clones 3, 13 and 32 at their respective chromosomal loci in normal and transformed cell lines. Histogram plots of the quantification by real-time PCR of nascent DNA abundance (ng) at the chromosomal loci of clones 3, 13 and 32, respectively, of two transformed [HeLa and WI38(SV40)] (gray bars) and two normal (NSF and WI38) (white bars) cell lines. Each of the 15 primer sets amplifies a region of ∼200–400 bp in size: M, a region containing the autonomously replicating sequence (predicted origin sequences) of clone 3 (A), 13 (B) and 32 (C); L, a region located ∼500–1000 bp 5′ (upstream) of the M region; R, a region located ∼500–1000 bp 3′ (downstream) of the M region; FL (negative control), a region located ∼5–7 kb 5′ (upstream) of the M region; FR (negative control), a region located ∼5–7 kb 3′ (downstream) of the M region. For the location of all primers used in the study, see Supplementary Table S2. The error bars represent the average of at least two experiments performed in triplicate and 1 SD.
Figure 4.
Figure 4.
In vivo association of ORC2, cdc6 and cdt1 to the chromosomal loci of clones 3, 13 and 32 in normal and transformed cell lines. Histogram plots of the quantification by real-time PCR of immunoprecipitated DNA abundance (ng) at the chromosomal loci of clones 3 (A), 13 (B) and 32 (C) respectively, in two transformed cell lines [HeLa and WI38(SV40)] and two normal cell lines (NSF and WI38). Chromatin IP was performed with antibodies directed against ORC2 (dark gray bars), cdc6 (white bars) and cdt1 (light gray bars); normal rabbit serum (NRS) (black bars) was used as a negative control. The primer sets of clones 3 (A), 13 (B) and 32 (C) are explained in the legend of Figure 3 and Supplementary Table S2. The error bars represent the average of at least two experiments performed in triplicate and 1 SD. (D) Western blot analysis using anti-ORC2, anti-cdc6 and anti-cdt1 antibodies to verify the IP of ORC2, cdc6 and cdt1 proteins in all cell lines used. IP with NRS was used as a negative control.
Figure 5.
Figure 5.
Formation of DNA replication complexes on the clone 3 origin containing sequence. (A) EMSA showing the formation of protein–DNA complexes on probe 3P (ori) and probe 3C (control); 0.4 fmol of radiolabeled probes 3P (lanes 1–5) or 3C (lanes 6–10) was incubated with 10 μg of NEs prepared from HeLa (lanes 2 and 7), WI38(SV40) (lanes 3 and 8), WI38 (lanes 4 and 9), NSF (lanes 5 and 10) cells and then subjected to non-denaturing polyacrylamide electrophoresis. Complexes 1 and 2 (indicated by arrows) represent protein–DNA complexes that only form in the presence of probe 3P and not probe 3C, while complex asterisk (indicated by an arrow) represents a non-specific protein–DNA complex formed in the presence of both probes 3P and 3C. (B) Competition EMSAs showing the sequence specificity of the protein-DNA complexes 1 and 2 but not complex asterisk formed onto probe 3P (lanes 1 and 7) in (i) HeLa (lanes 2–6) and WI38(SV40) (lanes 8–12) NEs and in (ii) WI38 (lanes 2–6) and NSF (lanes 8–12) NEs. Inset shows a magnification of the area of interest in Figure 5Bii. (C) Supershift EMSAs showing that the protein-DNA complex 1 on probe 3P (ori) contains pre-RC proteins in (i) HeLa and (ii) WI38(SV40) NEs (compare complex 1 to its supershifted position S1), but not in (iii) WI38 and (iv) NSF NEs. Lane 1: Probe 3P alone; lane 2: Probe 3P incubated with NRS; lane 3: Probe 3P incubated with NEs; lane 4: Probe 3P incubated with NEs + NRS; lane 5: Probe 3P incubated with NEs + anti-ORC1; lane 6: Probe 3P incubated with NEs + anti-ORC1; lane 7: Probe 3P incubated with NEs + anti-ORC2; lane 8: Probe 3P incubated with NEs + anti-ORC3; lane 9: Probe 3P incubated with NEs + anti-ORC4; lane 10: Probe 3P incubated with NEs + anti-ORC5; lane 11: Probe 3P incubated with NEs + anti-cdc6. Probe incubated with NRS and probe incubated with NEs and NRS were used as controls to confirm the specific binding of the antibodies.
Figure 5.
Figure 5.
Formation of DNA replication complexes on the clone 3 origin containing sequence. (A) EMSA showing the formation of protein–DNA complexes on probe 3P (ori) and probe 3C (control); 0.4 fmol of radiolabeled probes 3P (lanes 1–5) or 3C (lanes 6–10) was incubated with 10 μg of NEs prepared from HeLa (lanes 2 and 7), WI38(SV40) (lanes 3 and 8), WI38 (lanes 4 and 9), NSF (lanes 5 and 10) cells and then subjected to non-denaturing polyacrylamide electrophoresis. Complexes 1 and 2 (indicated by arrows) represent protein–DNA complexes that only form in the presence of probe 3P and not probe 3C, while complex asterisk (indicated by an arrow) represents a non-specific protein–DNA complex formed in the presence of both probes 3P and 3C. (B) Competition EMSAs showing the sequence specificity of the protein-DNA complexes 1 and 2 but not complex asterisk formed onto probe 3P (lanes 1 and 7) in (i) HeLa (lanes 2–6) and WI38(SV40) (lanes 8–12) NEs and in (ii) WI38 (lanes 2–6) and NSF (lanes 8–12) NEs. Inset shows a magnification of the area of interest in Figure 5Bii. (C) Supershift EMSAs showing that the protein-DNA complex 1 on probe 3P (ori) contains pre-RC proteins in (i) HeLa and (ii) WI38(SV40) NEs (compare complex 1 to its supershifted position S1), but not in (iii) WI38 and (iv) NSF NEs. Lane 1: Probe 3P alone; lane 2: Probe 3P incubated with NRS; lane 3: Probe 3P incubated with NEs; lane 4: Probe 3P incubated with NEs + NRS; lane 5: Probe 3P incubated with NEs + anti-ORC1; lane 6: Probe 3P incubated with NEs + anti-ORC1; lane 7: Probe 3P incubated with NEs + anti-ORC2; lane 8: Probe 3P incubated with NEs + anti-ORC3; lane 9: Probe 3P incubated with NEs + anti-ORC4; lane 10: Probe 3P incubated with NEs + anti-ORC5; lane 11: Probe 3P incubated with NEs + anti-cdc6. Probe incubated with NRS and probe incubated with NEs and NRS were used as controls to confirm the specific binding of the antibodies.
Figure 6.
Figure 6.
Verification of the proteins in the complex identified by EMSA and mass spectrometry. Western blot analysis performed on (A) T (electroeluted excised cdc6 supershift bands from transformed NEs) and N (electroeluted excised cdc6 supershift bands from normal NEs) samples as well as (B) T (electroeluted excised cdc6 supershift bands from transformed NEs) and C (electroeluted excised control bands) samples after SDS-PAGE and transfer onto a PVDF membrane to confirm the composition of the transformation-specific complex with the following antibodies: anti-cdc6, anti-EEF1D, anti-Fe65, anti-FKBP-25, anti-ORC1, anti-ORC2, and anti-REF-1. The protein complexes have been analyzed independently a total of 4 times and the experiments were performed from different cell batches giving the same result each time.
Figure 7.
Figure 7.
Comparative analysis of the expression, chromatin-bound levels as well as in vivo association of Fe65, REF-1, FKBP-25 and EEF1D to the chromosomal locus of clone 3 in normal and transformed cell lines. (A) Expression levels and (B) Chromatin bound levels of Fe65, REF-1, FKBP-25 and EEF1D. Twenty and forty micrograms of whole-cell extracts or chromatin-enriched fractions were subjected to SDS-PAGE and transferred onto a PVDF membrane and probed with anti-Fe65, anti-REF-1, anti-FKBP-25 and anti-EEF1D antibodies. Anti-actin was used as a loading control. (C) Histogram plot of the quantification by real-time PCR of immunoprecipitated DNA abundance (ng) at the chromosomal locus of clone 3 in two transformed [HeLa and WI38(SV40)] and two normal (NSF and WI38) cell lines. Chromatin IP of the clone 3 chromosomal region was performed with antibodies directed against Fe65 (dark gray bars), REF-1 (white bars), FKBP-25 (light gray bars) and EEF1D (spotted grey bars); normal rabbit serum (NRS) (black bars) was used as a negative control. The clone 3 primer sets are described in the legend of Figure 3 and Supplementary Table S2. The error bars represent the average of at least two experiments performed in triplicate and one standard deviation. (D) Western blot analysis using anti-Fe65, anti-REF-1, anti-FKBP-25 and anti-EEF1D antibodies to verify the IP of Fe65, REF-1, FKBP-25 and EEF1D proteins in all cell lines used. IP with NRS was used as a negative control.

Similar articles

Cited by

References

    1. Jacob F, Brenner S, Cuzin F. On the regulation of DNA replication in bacteria. Cold Spring Harbor Symp. Quant. Biol. 1963;28:329–348.
    1. Edenberg HJ, Huberman JA. Eukaryotic chromosome replication. Annu. Rev. Genet. 1975;9:245–284. - PubMed
    1. Hand R. Eucaryotic DNA: organization of the genome for replication. Cell. 1978;15:317–325. - PubMed
    1. Zannis-Hadjopoulos M, Price GB. Eukaryotic DNA replication. J. Cell. Biochem. 1999;Supplements 32/33:1–14. - PubMed
    1. Machida YJ, Hamlin JL, Dutta A. Right place, right time, and only once: replication initiation in metazoans. Cell. 2005;123:13–24. - PubMed

Publication types